EA Binding
20 minutes read
## Binding in Dashboards
- Bindings enable interaction among the widgets in the Dashboard
- Control the interactions by **binding** steps to each other
### 2 types of binding, which triggers updates in other steps in the Dashboard:
1. **Selection** binding - updates a step based on the selection by the user in a widget - interactive
Can be used specify interactions between widgets which use steps from **different datasets**
2. **Results** binding - updates a step based on the results of the another step
Use case: Define intermediate results for a complex calculation.
**Calculate the total opportunity amount for the top-5 products:**
- use one step to calculate the top-five products
- use those results to *filter* another step that calculates the total number opportunity amount for each product
### Steps needed before making the widgets interactive
- Faceting - most common way to specify interactions between widgets
- When facted, selections made in one widget automatically filter **all other** widgets when they are using **steps** from the **same dataset** (scope)
- Faceting works only on the **steps** from the **same dataset**
- To create interactions outside, **binding is the way**
### Bindings in Dashboard Designer Dashboards
- Both types of bindings operate on tabular data and return complete rows, even for columns not used in widgets
- The dashboard designer treats *multiple selections as tabular data* and *single selections* as a *single row* of tabular data.
### Syntax
```java
stepId.result|selection
// example:
myStaticStep.selection
"{{Data_Selection_Function(step_name.Binding_Function, Details_From_Reference_Step).Data_Serialization_Function()}}"
```
- Data Selection Function
- cell, column or row
- what data is being selected from a step or table
- Step Name
### Binding Functions
- To get data from a **source step**, **manipulate it**, and **serialize** it to make it consumable by the target step
Binding functions operate on input data with one the following shapes:
1. Scalar like: ``` 0, "hello world" ```
2. 1-D array like: ``` [10,20,30], ["North", "South", "East", "West"] ```
3. 2-D array like: ``` [ ["Apple", "Mango"], ["Oak", "Pine"] ] ```
- Each binding must have one **data selection function** and one **data serialization** function and optionally can have multiple **data manipulation** functions.
## Measure Binding Demo
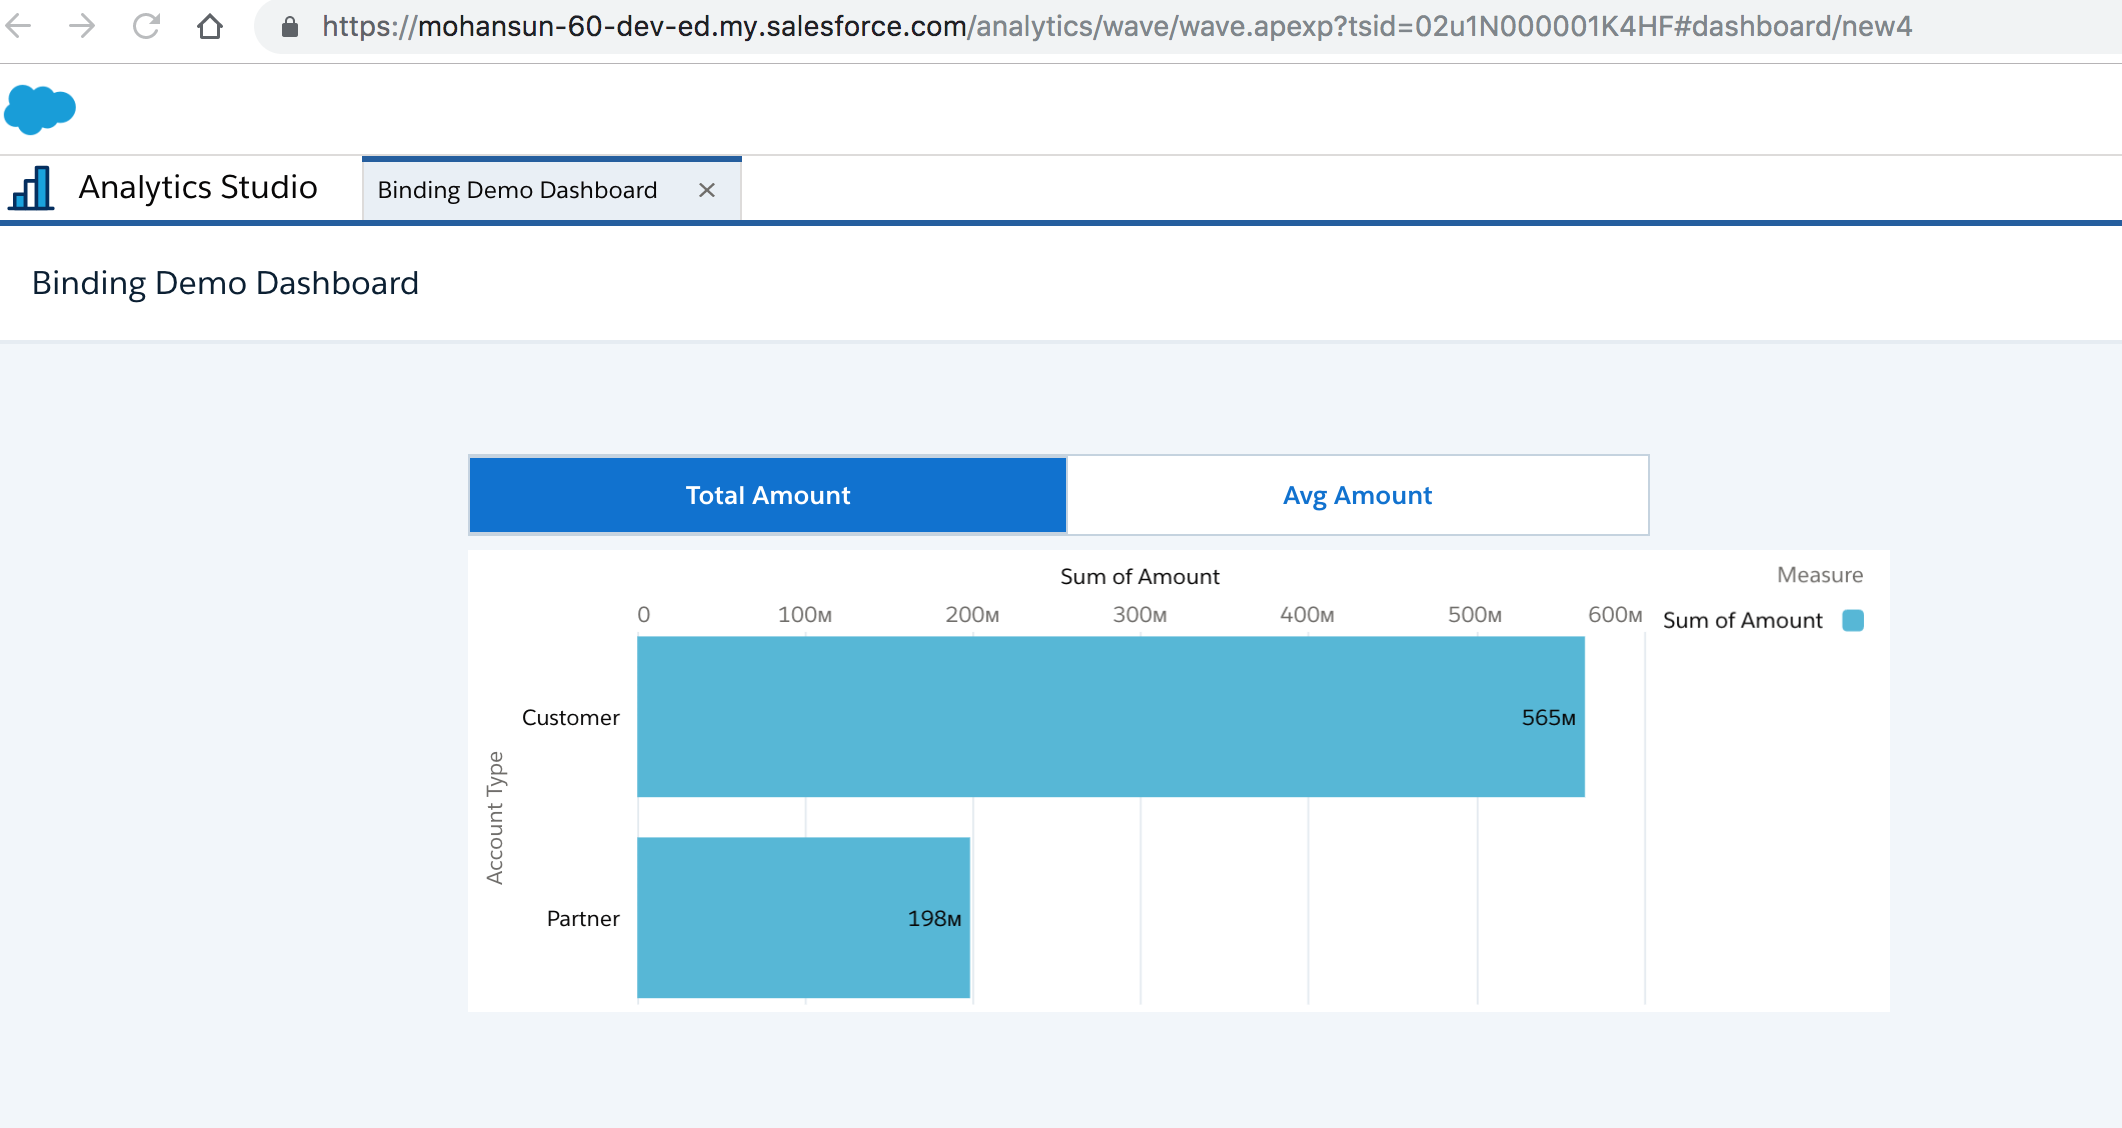
### Key items
- Static Step (StaticMeasureNames_1) values
```json
"values": [
{
"display": "Total Amount",
"value": [
"sum",
"Amount"
]
},
{
"display": "Avg Amount",
"value": [
"avg",
"Amount"
]
}
]
```
- Query for the receiving step (Account_Type_1)
```json
"query": {
"measures": "{{column(StaticMeasureNames_1.selection,[\"value\"]).asObject()}}",
"groups": [
"Account_Type"
]
}
```
- Note columnMap: null change required
Reason: Because when you change the query, the set of fields will likely be different from what’s in the columnMap
section. When you replace the columnMap property with **an empty columns array, the system remaps** the columns based on
the new query definition
### Demo
### Dashboard JSON
```json
{
"label": "Binding Demo Dashboard",
"mobileDisabled": false,
"state": {
"steps": {
"StaticMeasureNames_1": {
"type": "staticflex",
"numbers": [],
"strings": [],
"groups": [],
"broadcastFacet": true,
"selectMode": "singlerequired",
"label": "StaticMeasureNames",
"start": {
"display": [
"Total Amount"
]
},
"values": [
{
"display": "Total Amount",
"value": [
"sum",
"Amount"
]
},
{
"display": "Avg Amount",
"value": [
"avg",
"Amount"
]
}
]
},
"Account_Type_1": {
"type": "aggregateflex",
"query": {
"measures": "{{column(StaticMeasureNames_1.selection,[\"value\"]).asObject()}}",
"groups": [
"Account_Type"
]
},
"visualizationParameters": {
"options": {},
"type": "chart",
"parameters": {
"visualizationType": "hbar",
"autoFitMode": "keepLabels",
"theme": "wave",
"title": {
"label": "",
"fontSize": 14,
"subtitleLabel": "",
"subtitleFontSize": 11,
"align": "center"
},
"showValues": true,
"axisMode": "multi",
"binValues": false,
"bins": {
"breakpoints": {
"low": 0,
"high": 100
},
"bands": {
"low": {
"label": "",
"color": "#B22222"
},
"medium": {
"label": "",
"color": "#ffa500"
},
"high": {
"label": "",
"color": "#008000"
}
}
},
"dimensionAxis": {
"showAxis": true,
"showTitle": true,
"title": "",
"customSize": "auto",
"icons": {
"useIcons": false,
"iconProps": {
"column": "",
"fit": "cover",
"type": "round"
}
}
},
"measureAxis1": {
"sqrtScale": false,
"showAxis": true,
"customDomain": {
"showDomain": false
},
"showTitle": true,
"title": ""
},
"measureAxis2": {
"sqrtScale": false,
"showAxis": true,
"customDomain": {
"showDomain": false
},
"showTitle": true,
"title": ""
},
"legend": {
"show": true,
"showHeader": true,
"inside": false,
"descOrder": false,
"position": "right-top",
"customSize": "auto"
},
"tooltip": {
"customizeTooltip": false,
"showDimensions": true,
"dimensions": "",
"showMeasures": true,
"measures": "",
"showPercentage": true,
"showNullValues": true,
"showBinLabel": true
},
"trellis": {
"enable": false,
"showGridLines": true,
"flipLabels": false,
"type": "x",
"chartsPerLine": 4,
"size": [
100,
100
]
},
"applyConditionalFormatting": true,
"showActionMenu": true,
"columnMap": null
}
},
"datasets": [
{
"id": "0Fb1N000000LK1NSAW",
"name": "DTC_Opportunity_SAMPLE",
"label": "DTC Opportunity",
"url": "/services/data/v46.0/wave/datasets/0Fb1N000000LK1NSAW"
}
],
"useGlobal": true,
"isGlobal": false,
"broadcastFacet": true,
"receiveFacet": true,
"selectMode": "single"
}
},
"widgets": {
"chart_1": {
"type": "chart",
"parameters": {
"visualizationType": "hbar",
"autoFitMode": "keepLabels",
"theme": "wave",
"title": {
"label": "",
"fontSize": 14,
"subtitleLabel": "",
"subtitleFontSize": 11,
"align": "center"
},
"showValues": true,
"axisMode": "multi",
"binValues": false,
"bins": {
"breakpoints": {
"low": 0,
"high": 100
},
"bands": {
"low": {
"label": "",
"color": "#B22222"
},
"medium": {
"label": "",
"color": "#ffa500"
},
"high": {
"label": "",
"color": "#008000"
}
}
},
"dimensionAxis": {
"showAxis": true,
"showTitle": true,
"title": "",
"customSize": "auto",
"icons": {
"useIcons": false,
"iconProps": {
"column": "",
"fit": "cover",
"type": "round"
}
}
},
"measureAxis1": {
"sqrtScale": false,
"showAxis": true,
"customDomain": {
"showDomain": false
},
"showTitle": true,
"title": ""
},
"measureAxis2": {
"sqrtScale": false,
"showAxis": true,
"customDomain": {
"showDomain": false
},
"showTitle": true,
"title": ""
},
"legend": {
"show": true,
"showHeader": true,
"inside": false,
"descOrder": false,
"position": "right-top",
"customSize": "auto"
},
"tooltip": {
"customizeTooltip": false,
"showDimensions": true,
"dimensions": "",
"showMeasures": true,
"measures": "",
"showPercentage": true,
"showNullValues": true,
"showBinLabel": true
},
"trellis": {
"enable": false,
"showGridLines": true,
"flipLabels": false,
"type": "x",
"chartsPerLine": 4,
"size": [
100,
100
]
},
"applyConditionalFormatting": true,
"showActionMenu": true,
"columnMap": null,
"step": "Account_Type_1"
}
},
"pillbox_1": {
"type": "pillbox",
"parameters": {
"compact": false,
"showActionMenu": true,
"exploreLink": false,
"fontSize": 14,
"textColor": "#0070D2",
"selectedTab": {
"textColor": "#FFFFFF",
"backgroundColor": "#0070D2",
"borderEdges": [
"all"
],
"borderColor": "#C6D3E1",
"borderWidth": 1
},
"step": "StaticMeasureNames_1"
}
}
},
"filters": [],
"gridLayouts": [
{
"name": "Default",
"numColumns": 12,
"rowHeight": "normal",
"version": 1,
"pages": [
{
"label": "BindingDemo1",
"name": "fc29efa5-0f70-4c60-bd5c-b0d653b7b9a3",
"widgets": [
{
"row": 2,
"column": 2,
"rowspan": 5,
"colspan": 6,
"name": "chart_1",
"widgetStyle": {}
},
{
"row": 1,
"column": 2,
"rowspan": 1,
"colspan": 5,
"name": "pillbox_1",
"widgetStyle": {}
}
],
"navigationHidden": false
}
],
"selectors": [],
"style": {
"backgroundColor": "#F2F6FA",
"gutterColor": "#C5D3E0",
"cellSpacingX": 8,
"cellSpacingY": 8,
"fit": "original",
"alignmentX": "left",
"alignmentY": "top"
}
}
],
"dataSourceLinks": [],
"widgetStyle": {
"backgroundColor": "#FFFFFF",
"borderEdges": [],
"borderColor": "#E6ECF2",
"borderWidth": 1,
"borderRadius": 0
}
},
"datasets": [
{
"name": "DTC_Opportunity_SAMPLE",
"url": "/services/data/v46.0/wave/datasets/0Fb1N000000LK1NSAW",
"id": "0Fb1N000000LK1NSAW"
}
]
}
```
## Measures and Grouping Bindings demo
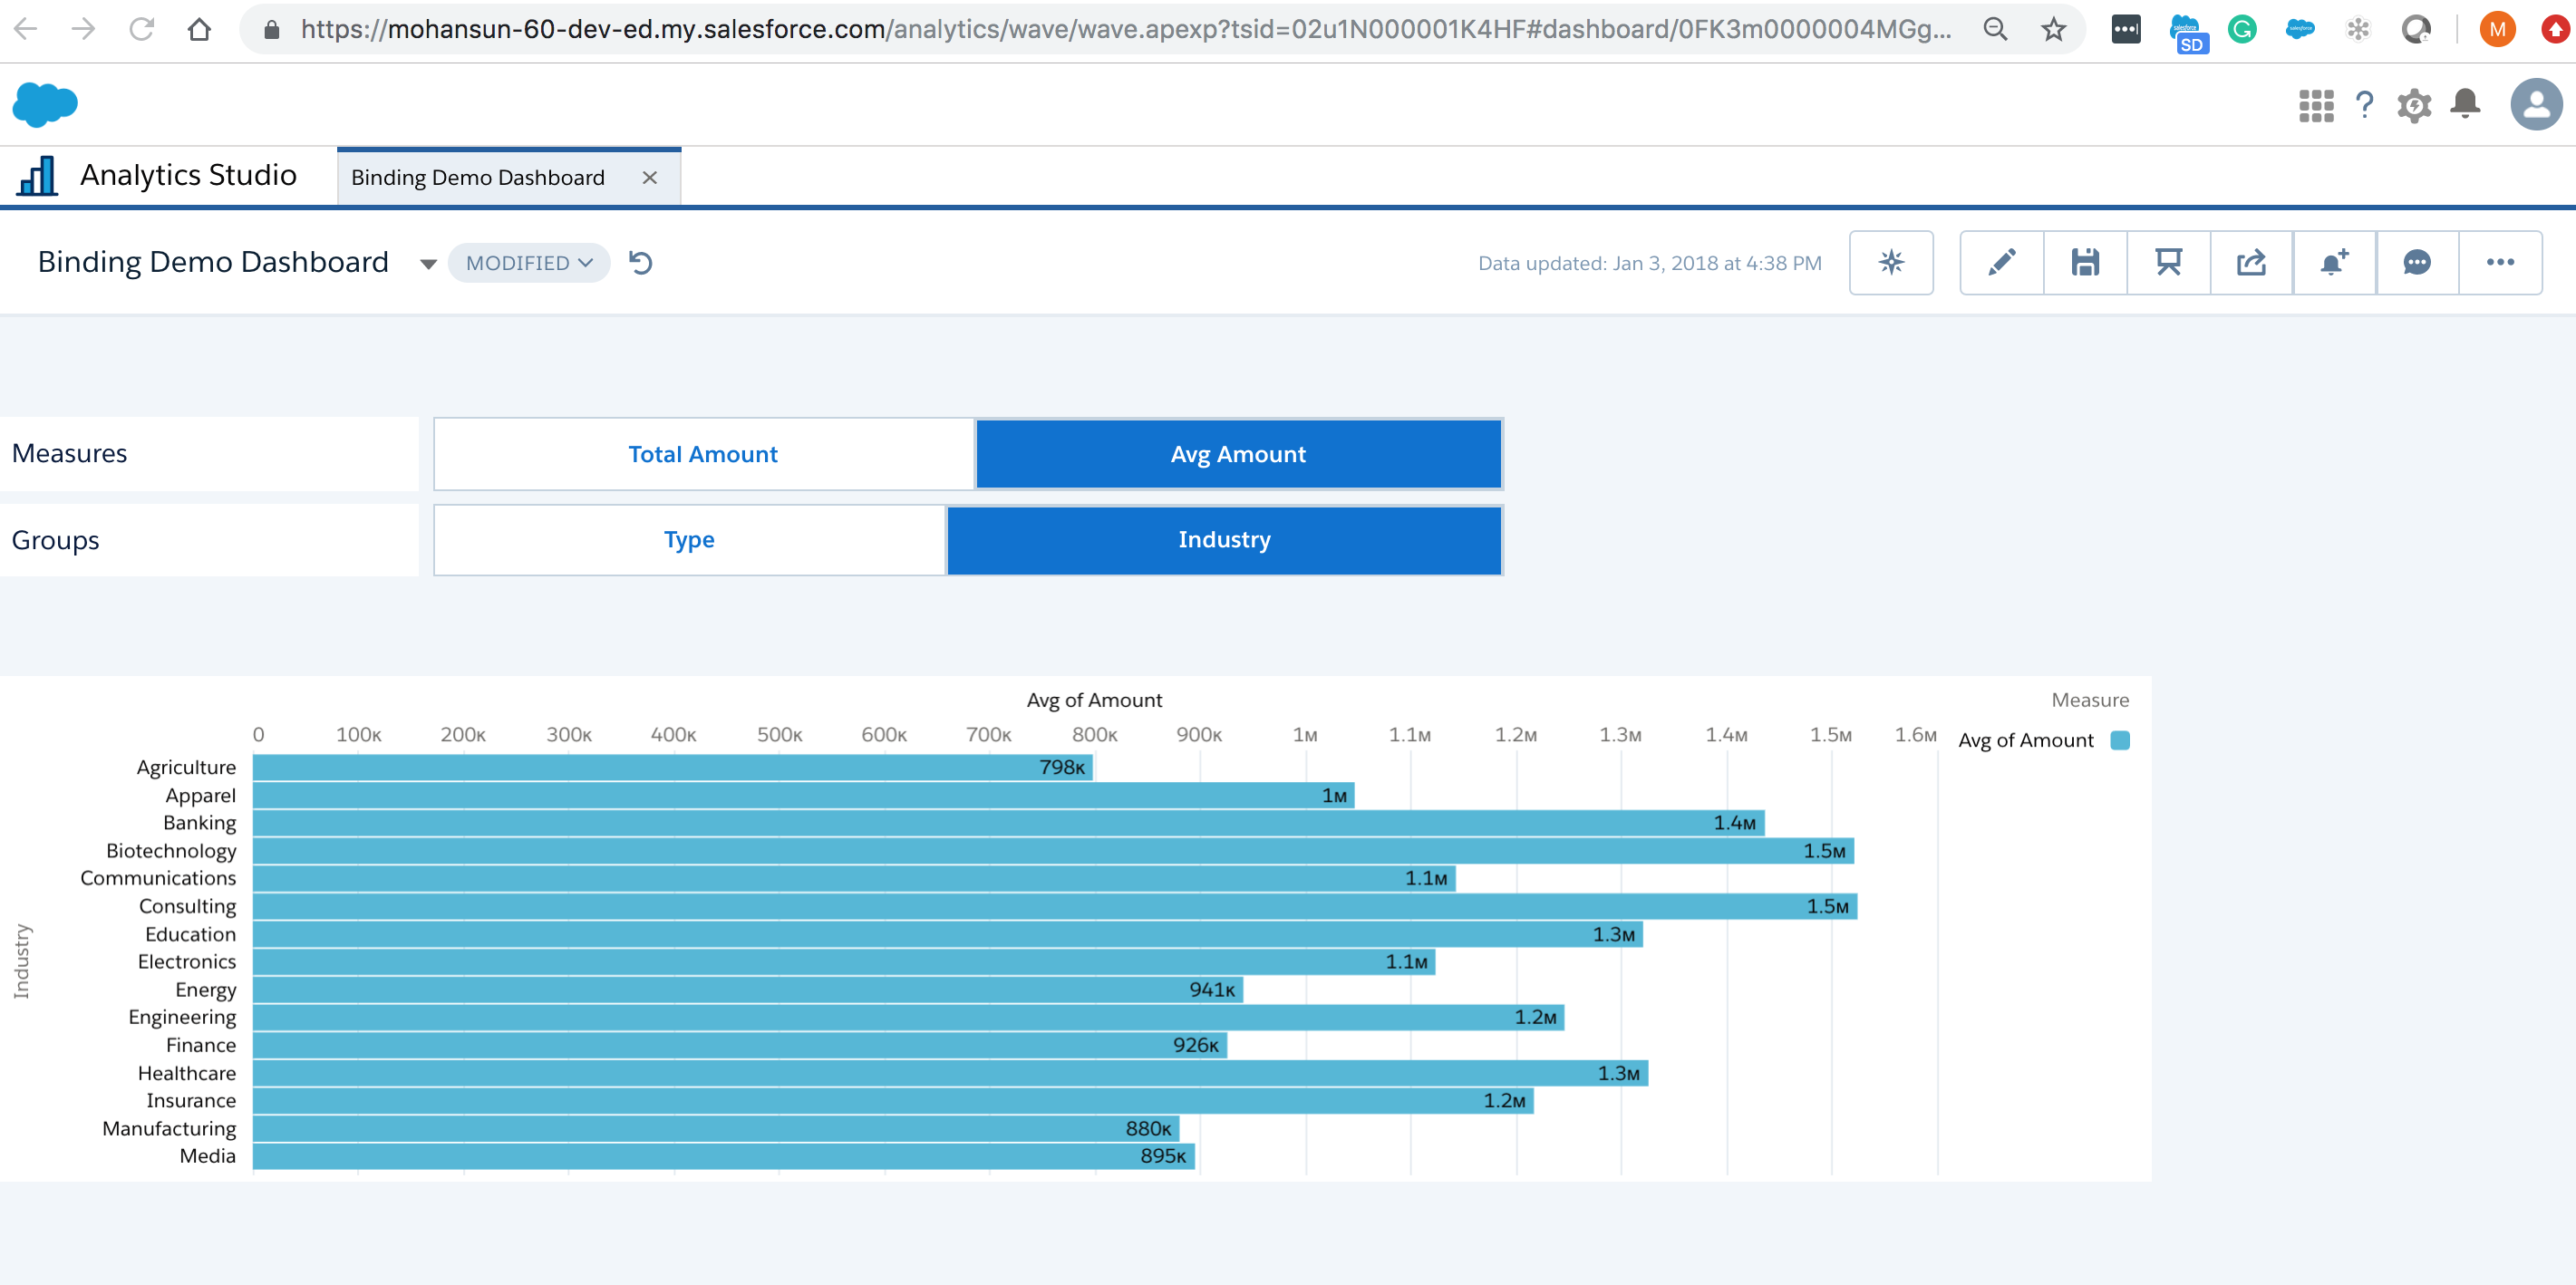
### Key items
- Static Step (StaticGroupingNames_1) values
```json
"values": [
{
"display": "Type",
"value": "Account_Type"
},
{
"display": "Industry",
"value": "Industry"
}
]
```
- Query for the receiving step (Account_Type_1)
```json
"query": {
"measures": "{{column(StaticMeasureNames_1.selection,[\"value\"]).asObject()}}",
"groups": "{{column(StaticGroupingNames_1.selection,[\"value\"]).asObject()}}"
}
```
### Demo
### Dashboard JSON
```json
{
"label": "Binding Demo Dashboard",
"mobileDisabled": false,
"state": {
"dataSourceLinks": [],
"filters": [],
"gridLayouts": [
{
"name": "Default",
"numColumns": 12,
"pages": [
{
"label": "BindingDemo1",
"name": "fc29efa5-0f70-4c60-bd5c-b0d653b7b9a3",
"navigationHidden": false,
"widgets": [
{
"colspan": 10,
"column": 0,
"name": "chart_1",
"row": 4,
"rowspan": 6,
"widgetStyle": {
"borderEdges": []
}
},
{
"colspan": 5,
"column": 2,
"name": "pillbox_1",
"row": 1,
"rowspan": 1,
"widgetStyle": {
"borderEdges": []
}
},
{
"colspan": 5,
"column": 2,
"name": "pillbox_2",
"row": 2,
"rowspan": 1,
"widgetStyle": {
"borderEdges": []
}
},
{
"colspan": 2,
"column": 0,
"name": "text_1",
"row": 1,
"rowspan": 1,
"widgetStyle": {
"borderEdges": []
}
},
{
"colspan": 2,
"column": 0,
"name": "text_2",
"row": 2,
"rowspan": 1,
"widgetStyle": {
"borderEdges": []
}
}
]
}
],
"rowHeight": "normal",
"selectors": [],
"style": {
"alignmentX": "left",
"alignmentY": "top",
"backgroundColor": "#F2F6FA",
"cellSpacingX": 8,
"cellSpacingY": 8,
"fit": "original",
"gutterColor": "#C5D3E0"
},
"version": 1
}
],
"layouts": [],
"steps": {
"StaticMeasureNames_1": {
"broadcastFacet": true,
"label": "StaticMeasureNames",
"selectMode": "singlerequired",
"start": {
"display": [
"Total Amount"
]
},
"type": "staticflex",
"values": [
{
"display": "Total Amount",
"value": [
"sum",
"Amount"
]
},
{
"display": "Avg Amount",
"value": [
"avg",
"Amount"
]
}
]
},
"Account_Type_1": {
"broadcastFacet": true,
"datasets": [
{
"id": "0Fb1N000000LK1NSAW",
"label": "DTC Opportunity",
"name": "DTC_Opportunity_SAMPLE",
"url": "/services/data/v46.0/wave/datasets/0Fb1N000000LK1NSAW"
}
],
"isGlobal": false,
"query": {
"measures": "{{column(StaticMeasureNames_1.selection,[\"value\"]).asObject()}}",
"groups": "{{column(StaticGroupingNames_1.selection,[\"value\"]).asObject()}}"
},
"receiveFacet": true,
"selectMode": "single",
"type": "aggregateflex",
"useGlobal": true,
"visualizationParameters": {
"parameters": {
"autoFitMode": "keepLabels",
"showValues": true,
"bins": {
"breakpoints": {
"high": 100,
"low": 0
},
"bands": {
"high": {
"color": "#008000",
"label": ""
},
"low": {
"color": "#B22222",
"label": ""
},
"medium": {
"color": "#ffa500",
"label": ""
}
}
},
"legend": {
"descOrder": false,
"showHeader": true,
"show": true,
"customSize": "auto",
"position": "right-top",
"inside": false
},
"axisMode": "multi",
"tooltip": {
"showBinLabel": true,
"measures": "",
"showNullValues": true,
"showPercentage": true,
"showDimensions": true,
"showMeasures": true,
"customizeTooltip": false,
"dimensions": ""
},
"visualizationType": "hbar",
"title": {
"fontSize": 14,
"subtitleFontSize": 11,
"label": "",
"align": "center",
"subtitleLabel": ""
},
"binValues": false,
"trellis": {
"flipLabels": false,
"showGridLines": true,
"size": [
100,
100
],
"enable": false,
"type": "x",
"chartsPerLine": 4
},
"columnMap": null,
"showActionMenu": true,
"measureAxis2": {
"sqrtScale": false,
"showTitle": true,
"showAxis": true,
"title": "",
"customDomain": {
"showDomain": false
}
},
"measureAxis1": {
"sqrtScale": false,
"showTitle": true,
"showAxis": true,
"title": "",
"customDomain": {
"showDomain": false
}
},
"theme": "wave",
"dimensionAxis": {
"showTitle": true,
"customSize": "auto",
"showAxis": true,
"title": "",
"icons": {
"useIcons": false,
"iconProps": {
"fit": "cover",
"column": "",
"type": "round"
}
}
},
"applyConditionalFormatting": true
},
"type": "chart"
}
},
"StaticGroupingNames_1": {
"broadcastFacet": true,
"label": "StaticGroupingNames",
"selectMode": "single",
"start": {
"display": [
"Type"
]
},
"type": "staticflex",
"values": [
{
"display": "Type",
"value": "Account_Type"
},
{
"display": "Industry",
"value": "Industry"
}
]
}
},
"widgetStyle": {
"backgroundColor": "#FFFFFF",
"borderColor": "#E6ECF2",
"borderEdges": [],
"borderRadius": 0,
"borderWidth": 1
},
"widgets": {
"pillbox_2": {
"parameters": {
"compact": false,
"exploreLink": false,
"fontSize": 14,
"selectedTab": {
"backgroundColor": "#0070D2",
"borderColor": "#C6D3E1",
"borderEdges": [
"all"
],
"borderWidth": 1,
"textColor": "#FFFFFF"
},
"showActionMenu": true,
"step": "StaticGroupingNames_1",
"textColor": "#0070D2"
},
"type": "pillbox"
},
"pillbox_1": {
"parameters": {
"compact": false,
"exploreLink": false,
"fontSize": 14,
"selectedTab": {
"backgroundColor": "#0070D2",
"borderColor": "#C6D3E1",
"borderEdges": [
"all"
],
"borderWidth": 1,
"textColor": "#FFFFFF"
},
"showActionMenu": true,
"step": "StaticMeasureNames_1",
"textColor": "#0070D2"
},
"type": "pillbox"
},
"text_1": {
"parameters": {
"fontSize": 16,
"showActionMenu": true,
"text": "Measures",
"textAlignment": "left",
"textColor": "#091A3E"
},
"type": "text"
},
"text_2": {
"parameters": {
"fontSize": 16,
"showActionMenu": true,
"text": "Groups",
"textAlignment": "left",
"textColor": "#091A3E"
},
"type": "text"
},
"chart_1": {
"parameters": {
"autoFitMode": "keepLabels",
"showValues": true,
"bins": {
"breakpoints": {
"high": 100,
"low": 0
},
"bands": {
"high": {
"color": "#008000",
"label": ""
},
"low": {
"color": "#B22222",
"label": ""
},
"medium": {
"color": "#ffa500",
"label": ""
}
}
},
"legend": {
"descOrder": false,
"showHeader": true,
"show": true,
"customSize": "auto",
"position": "right-top",
"inside": false
},
"axisMode": "multi",
"tooltip": {
"showBinLabel": true,
"measures": "",
"showNullValues": true,
"showPercentage": true,
"showDimensions": true,
"showMeasures": true,
"customizeTooltip": false,
"dimensions": ""
},
"visualizationType": "hbar",
"title": {
"fontSize": 14,
"subtitleFontSize": 11,
"label": "",
"align": "center",
"subtitleLabel": ""
},
"binValues": false,
"trellis": {
"flipLabels": false,
"showGridLines": true,
"size": [
100,
100
],
"enable": false,
"type": "x",
"chartsPerLine": 4
},
"showActionMenu": true,
"measureAxis2": {
"sqrtScale": false,
"showTitle": true,
"showAxis": true,
"title": "",
"customDomain": {
"showDomain": false
}
},
"measureAxis1": {
"sqrtScale": false,
"showTitle": true,
"showAxis": true,
"title": "",
"customDomain": {
"showDomain": false
}
},
"theme": "wave",
"step": "Account_Type_1",
"dimensionAxis": {
"showTitle": true,
"customSize": "auto",
"showAxis": true,
"title": "",
"icons": {
"useIcons": false,
"iconProps": {
"fit": "cover",
"column": "",
"type": "round"
}
}
},
"applyConditionalFormatting": true
},
"type": "chart"
}
}
},
"datasets": [
{
"id": "0Fb1N000000LK1NSAW",
"label": "DTC Opportunity",
"name": "DTC_Opportunity_SAMPLE",
"url": "/services/data/v46.0/wave/datasets/0Fb1N000000LK1NSAW"
}
]
}
```
### Sample EA Binding diagram

## Order Bindings
``` asOrder() ``` is used as serialization function to specify the sort order in a SAQL query.
Example:
```
// sortOrderSourceStep:
[
{order: "State", direction: "desc"}
{order: "City", direction: "asc"}
]
// Binding Query:
q = order q by {{ cell(sortOrderSourceStep.selection, 1, "order").asOrder() }};
// This get evaluated to (based on the selection by the user)
q = order q by 'State';
// OR
q = order q by 'City';
// Order multiple fields:
q = order q by {{column(sortOrderSourceStep.selection, ["order"]).asOrder()}};
// This get evaluated to:
q = order q by ('State', 'City');
// To specify the order and the direction:
q = order q by {{row(sortOrderSourceStep.selection, [], ["order", "direction"]).asOrder()}};
// This get evaluated to:
q = order q by ('State' desc, 'City' asc);
```
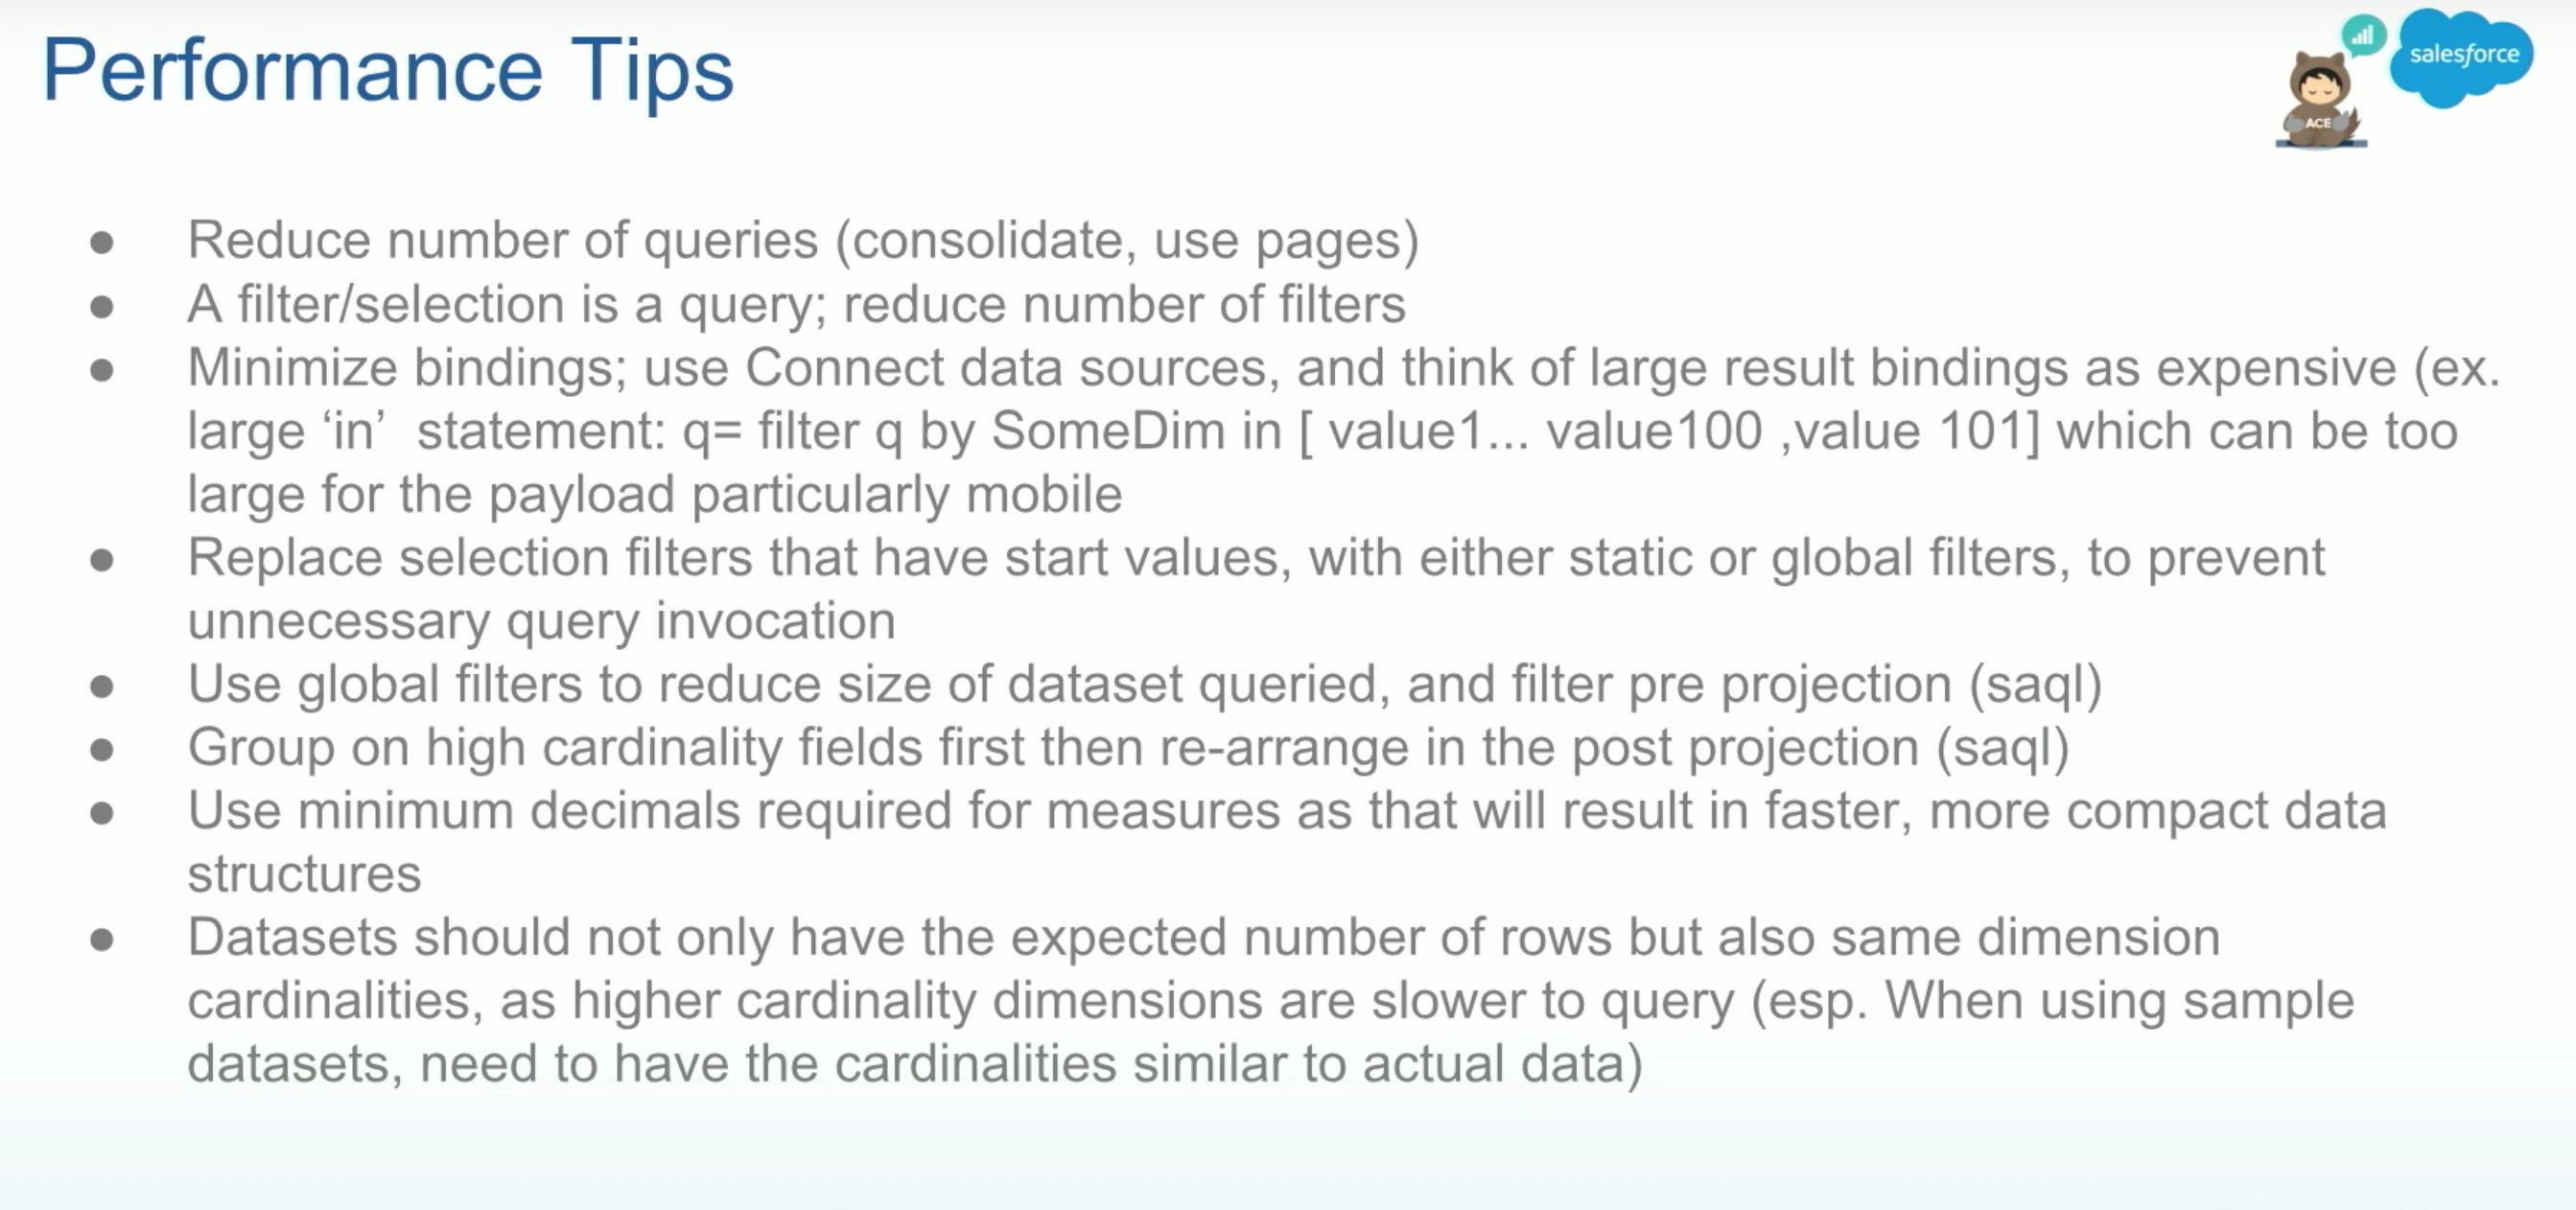
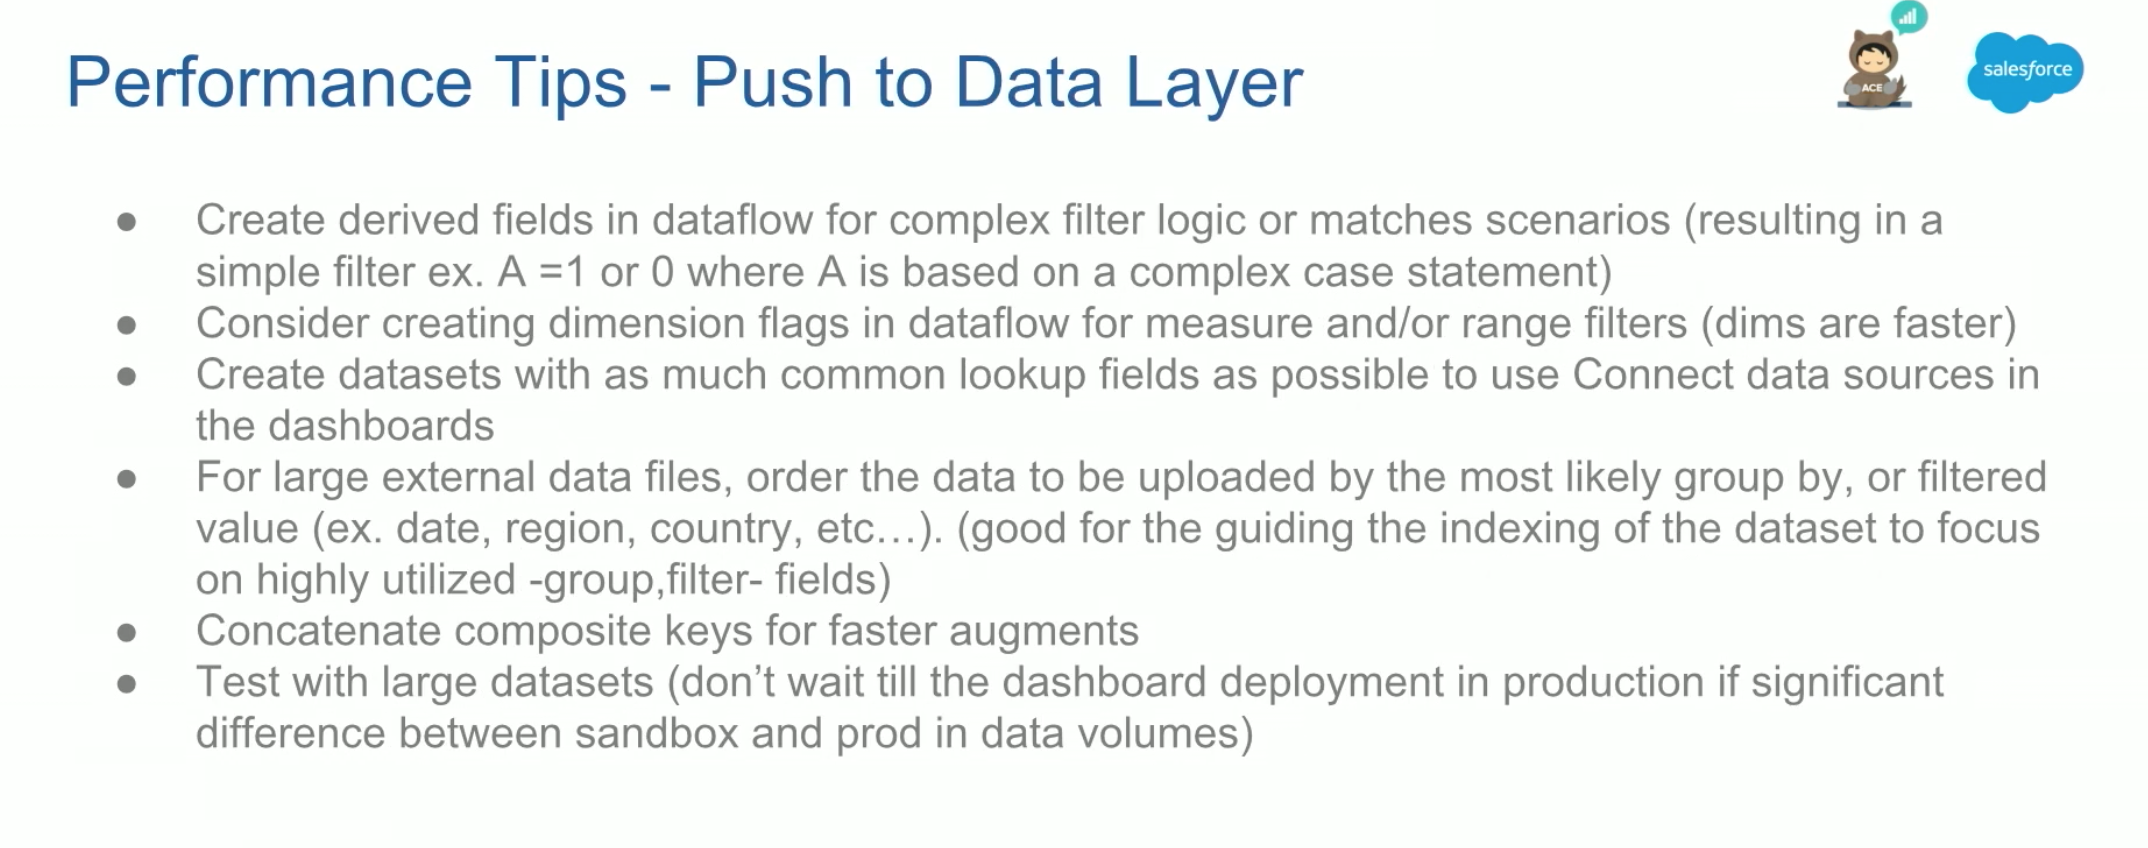
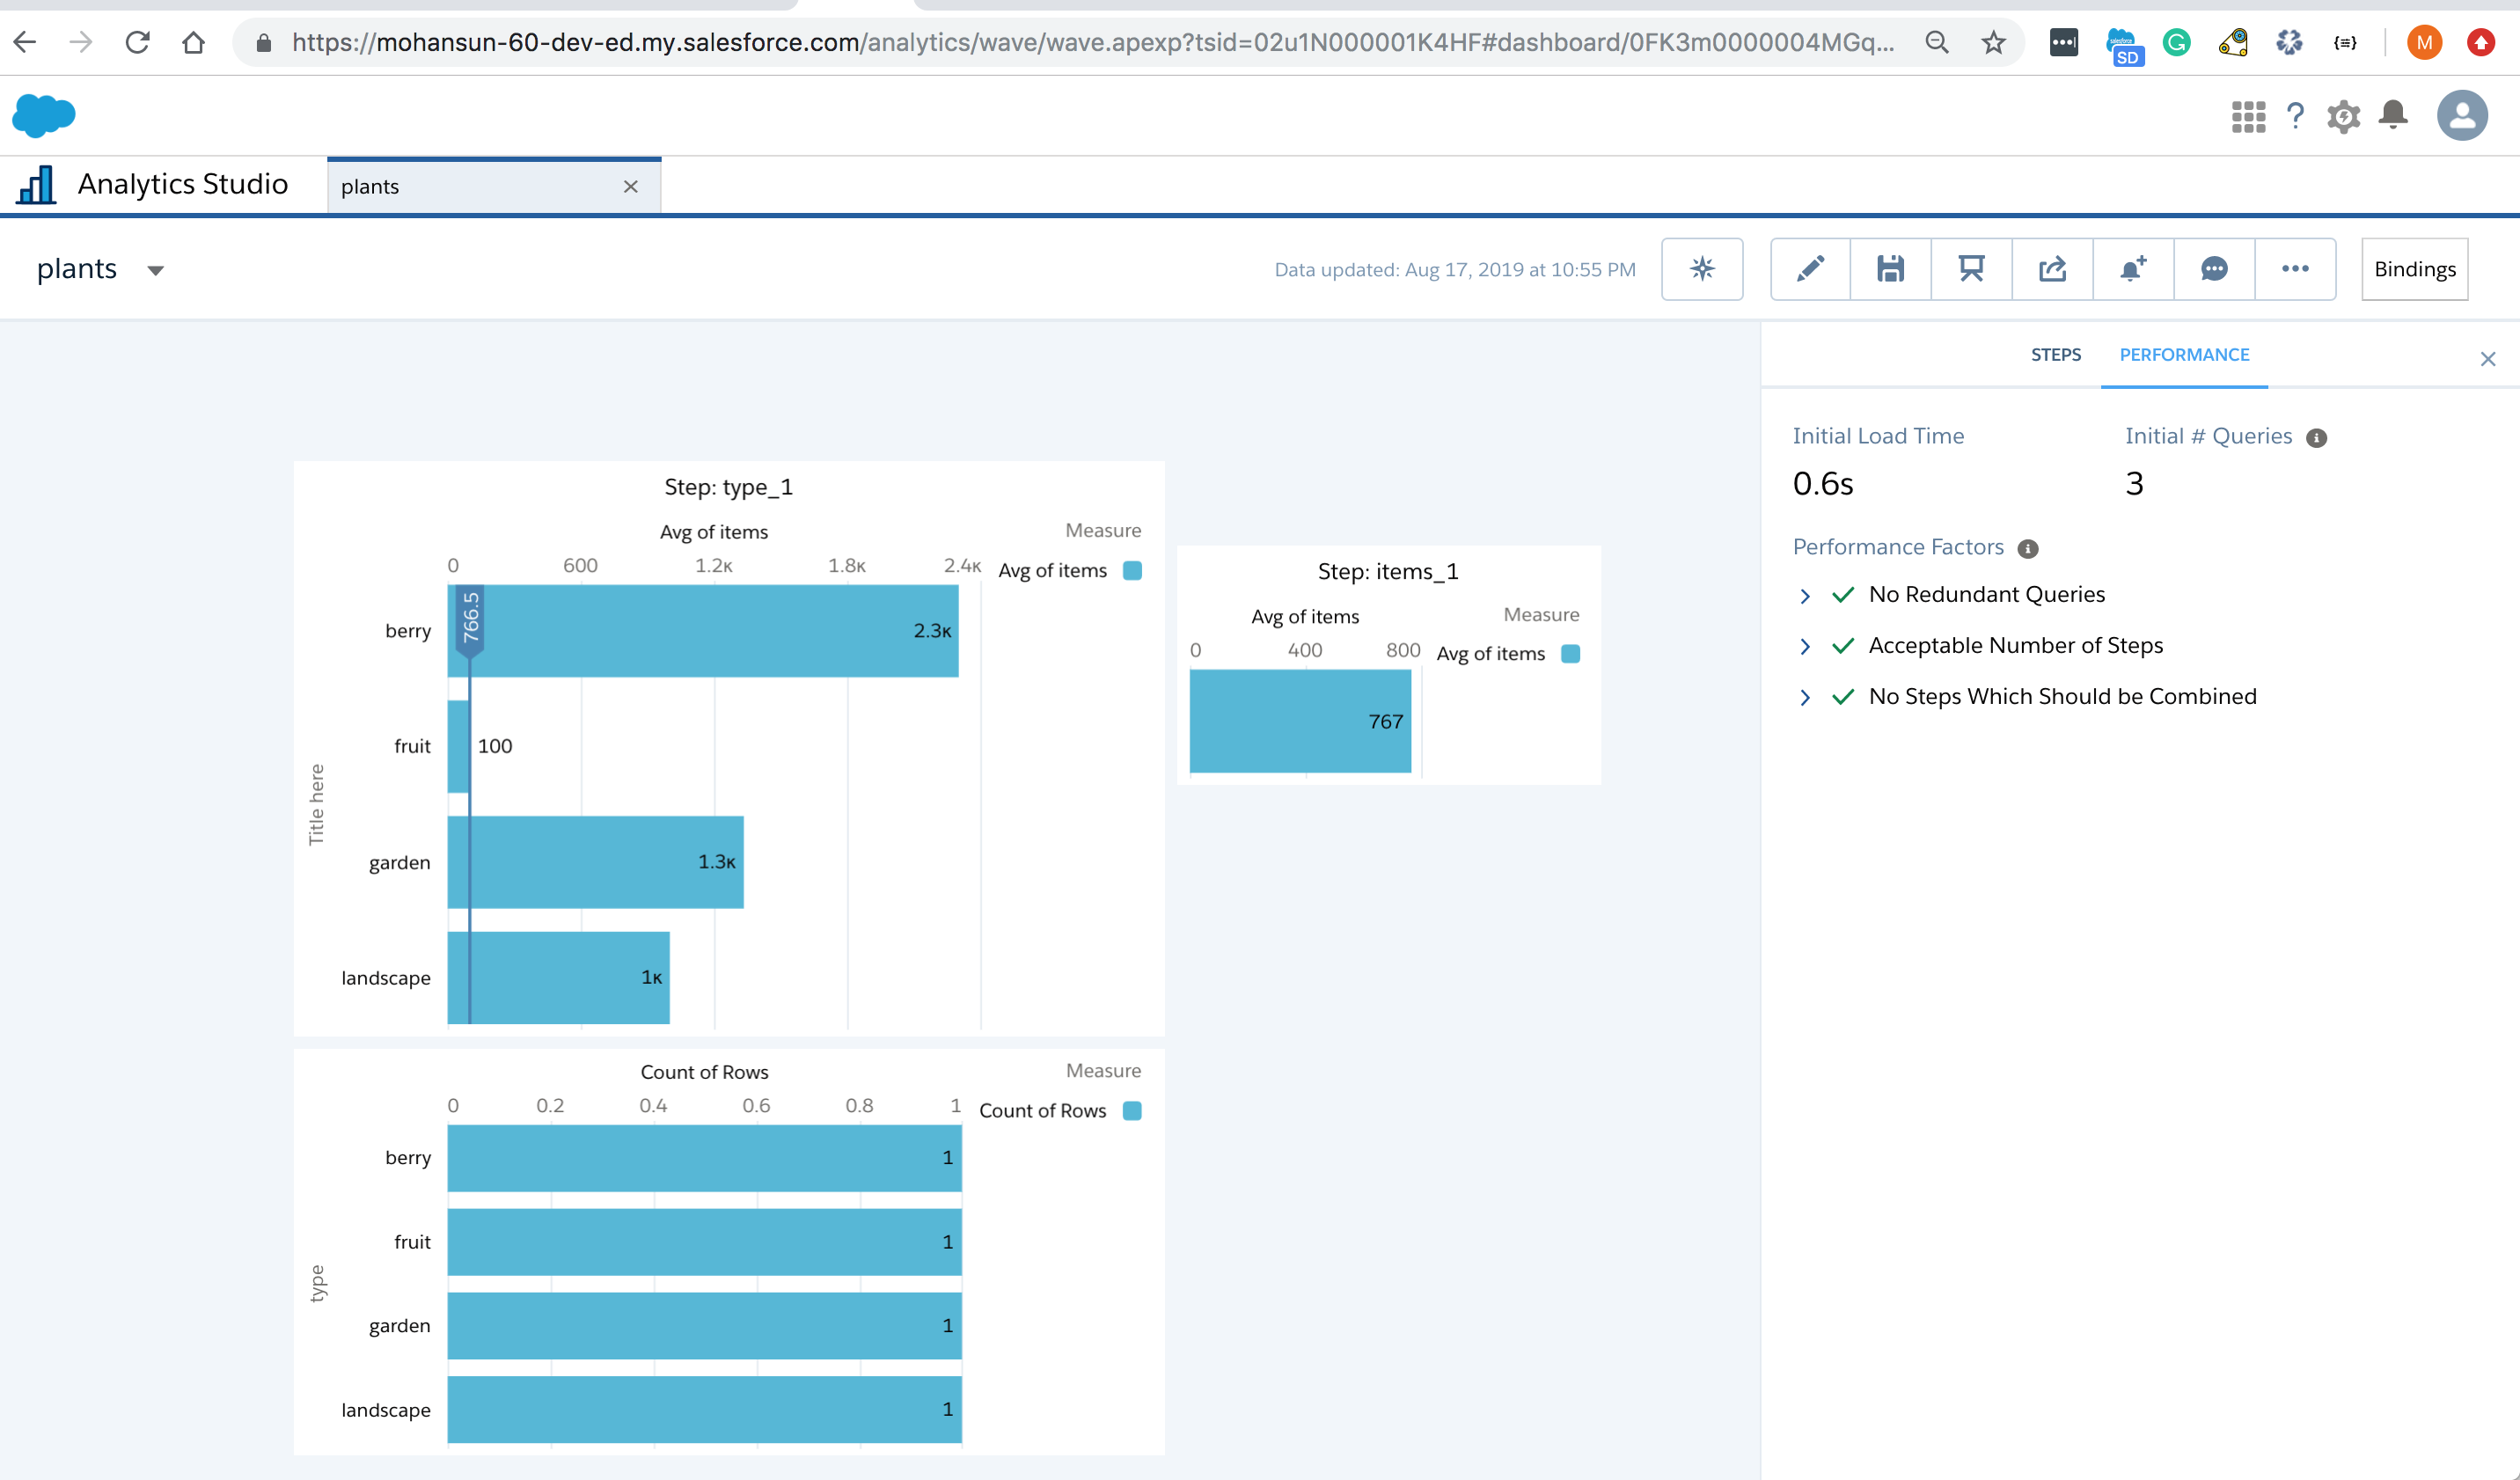
Performance Tips
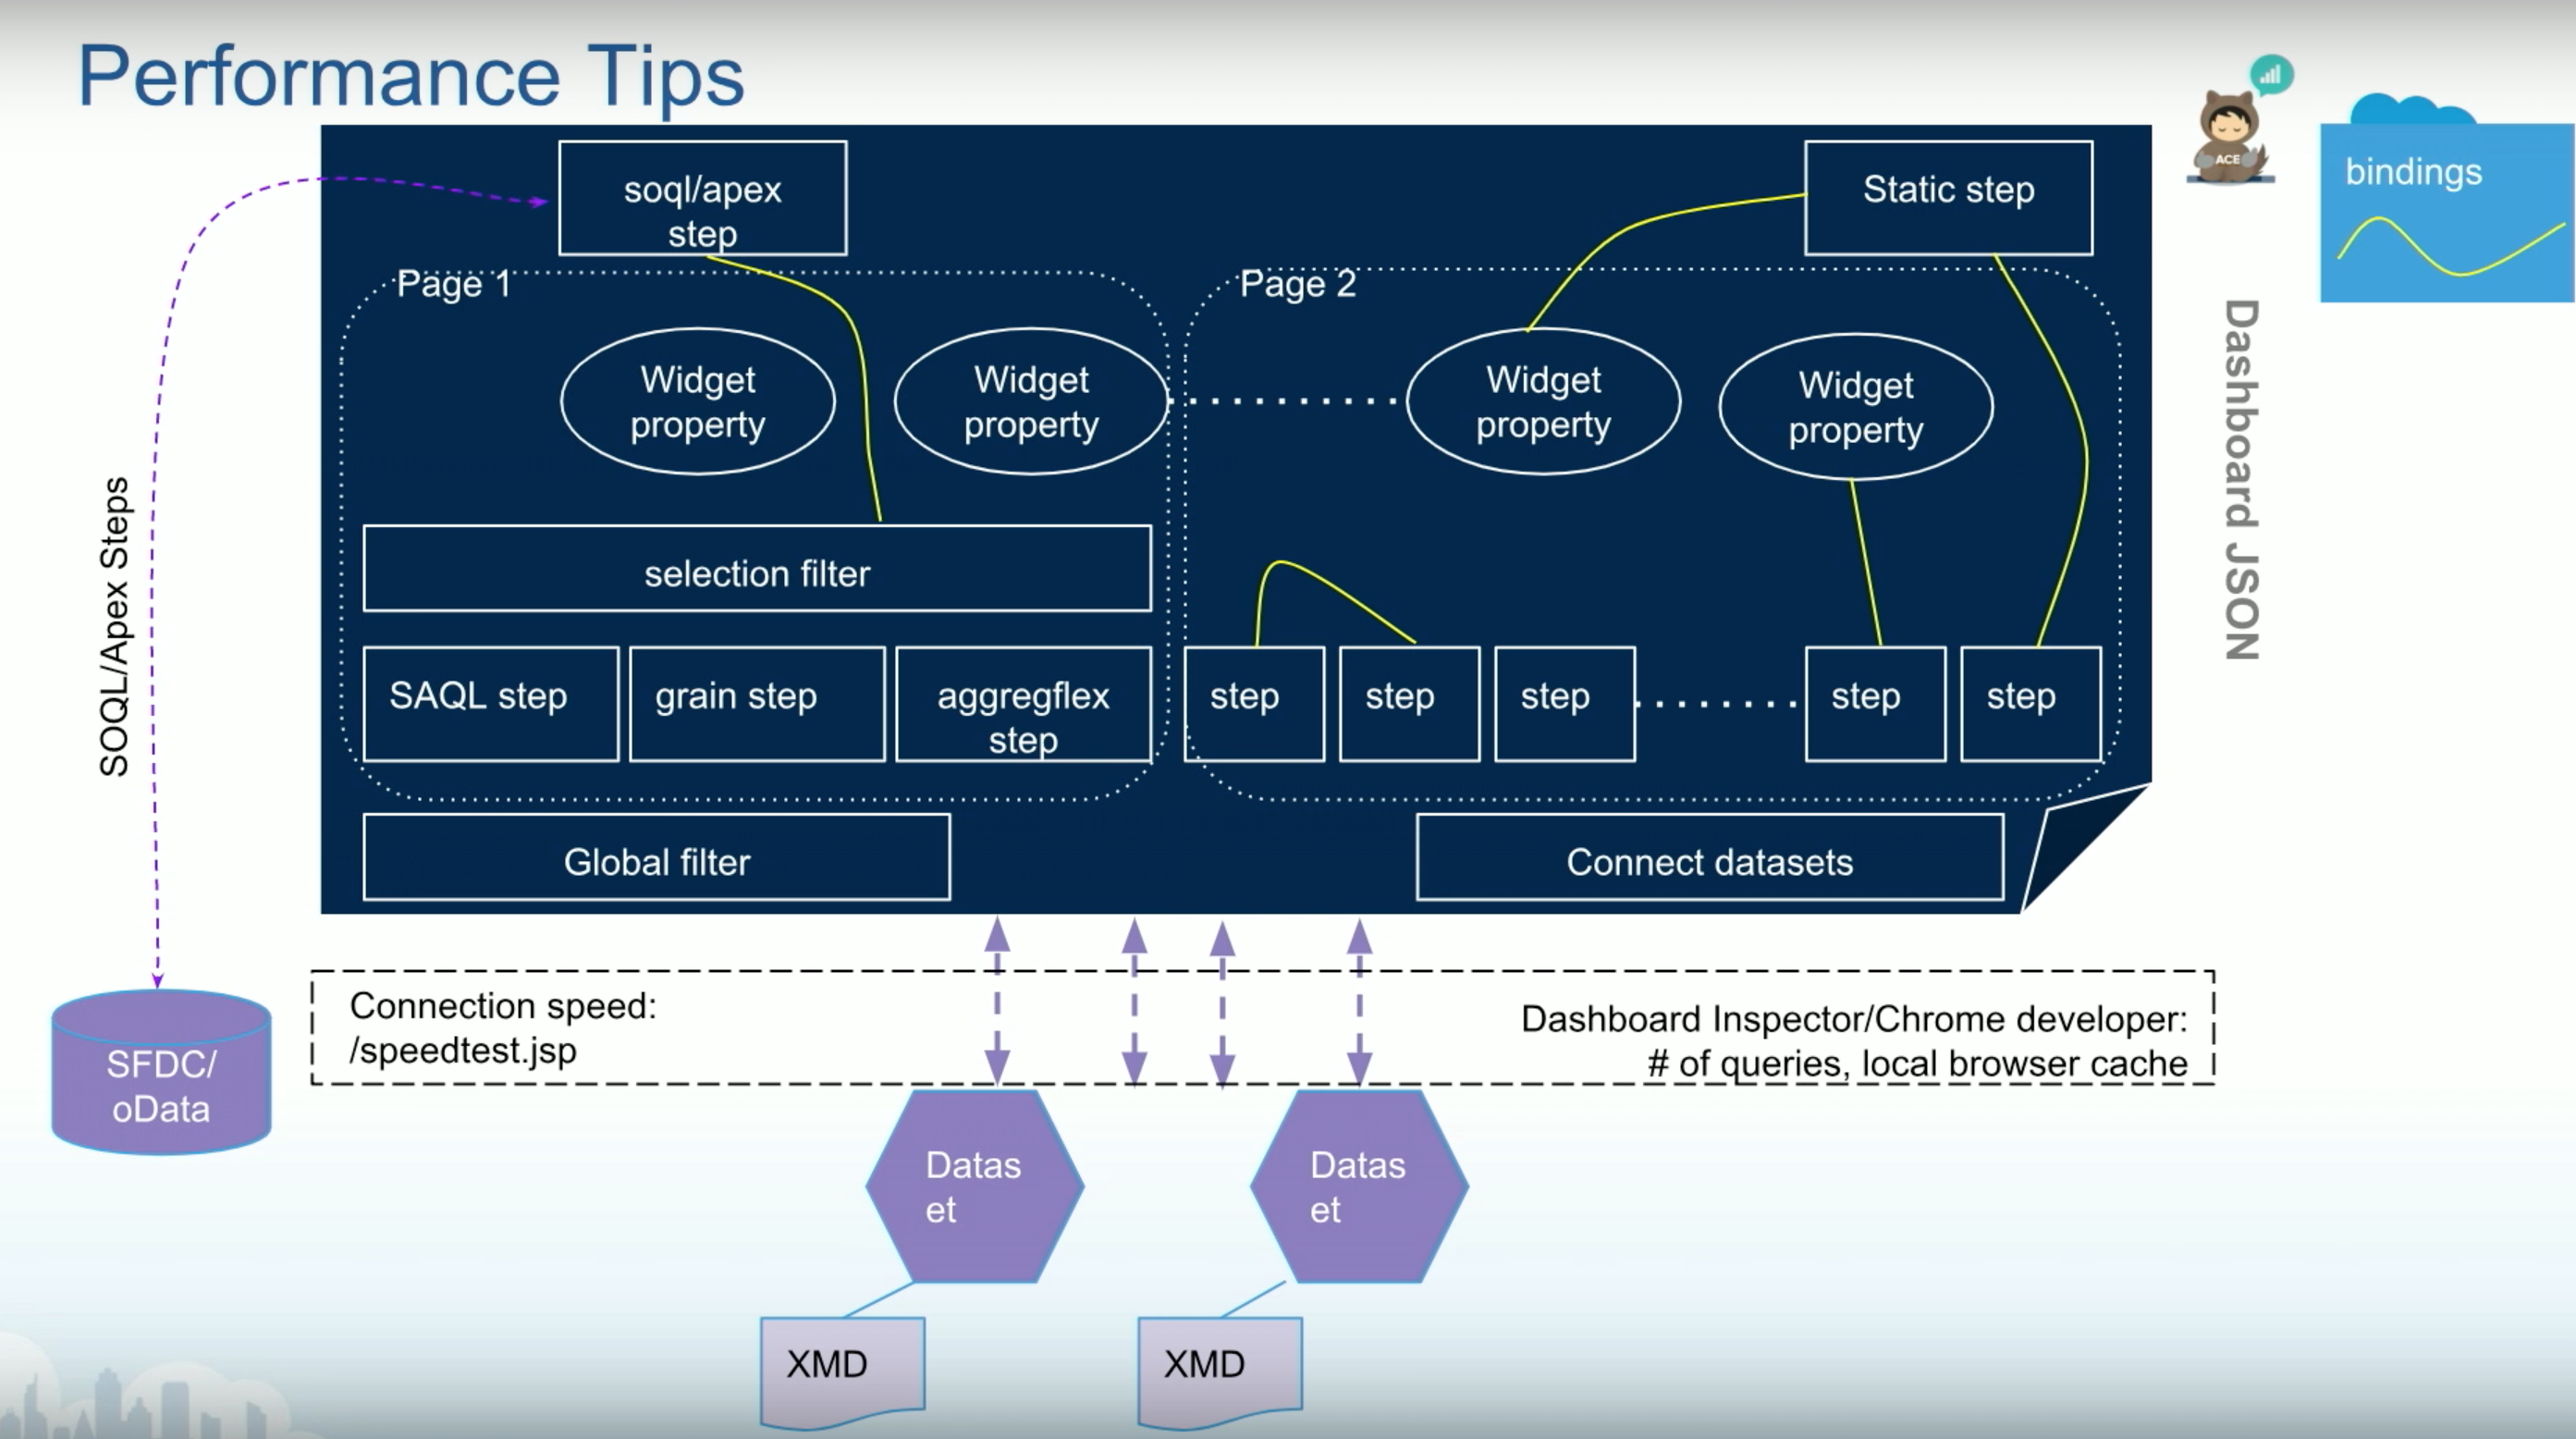
Key items
Dashboard Inspector
Demo
Performance info
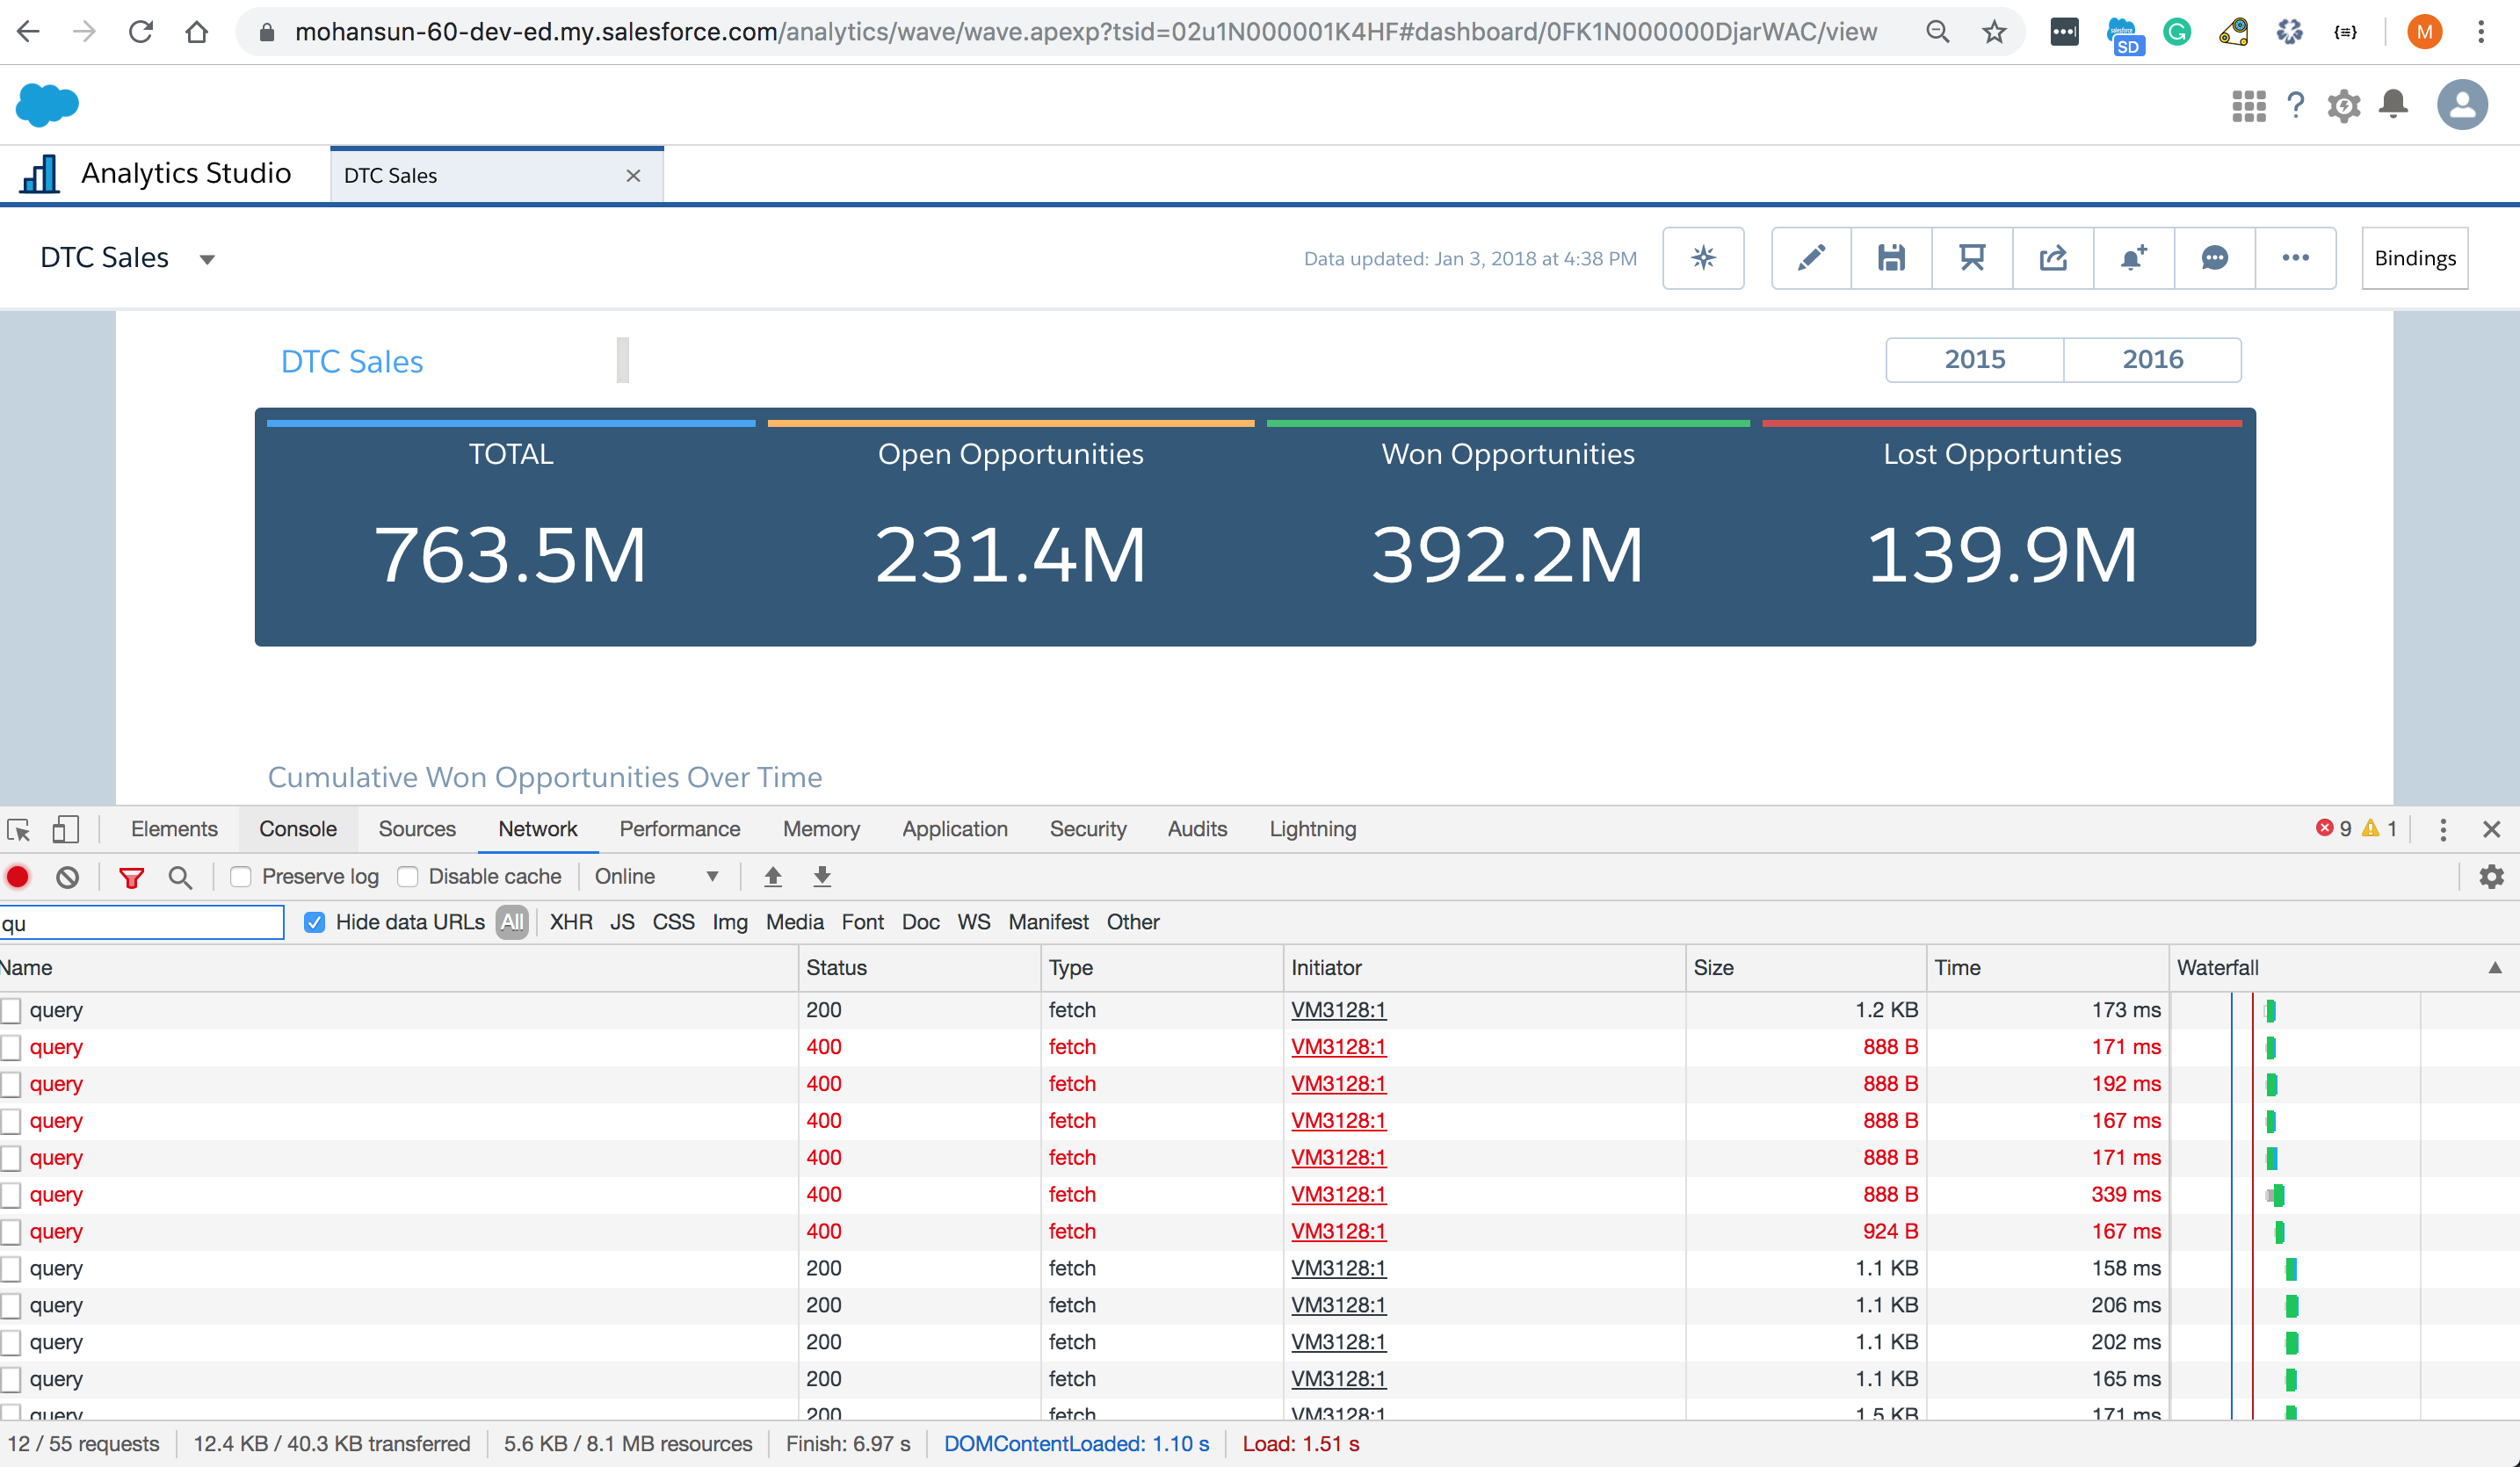
Inspecting using Developer Tools
Demo
Browser - HTTP 1.1
The HTTP 1.1 protocol states that single-user clients should not maintain more than two connections with any server or proxy. Browsers like Chrome and Firefox has a limit of 6 connections. If we have Dashboard requiring say 14 query executions, Chrome will do this in 3 batches, each with : 6, 6 and 2 connections.
Waterfall - connections in Chrome
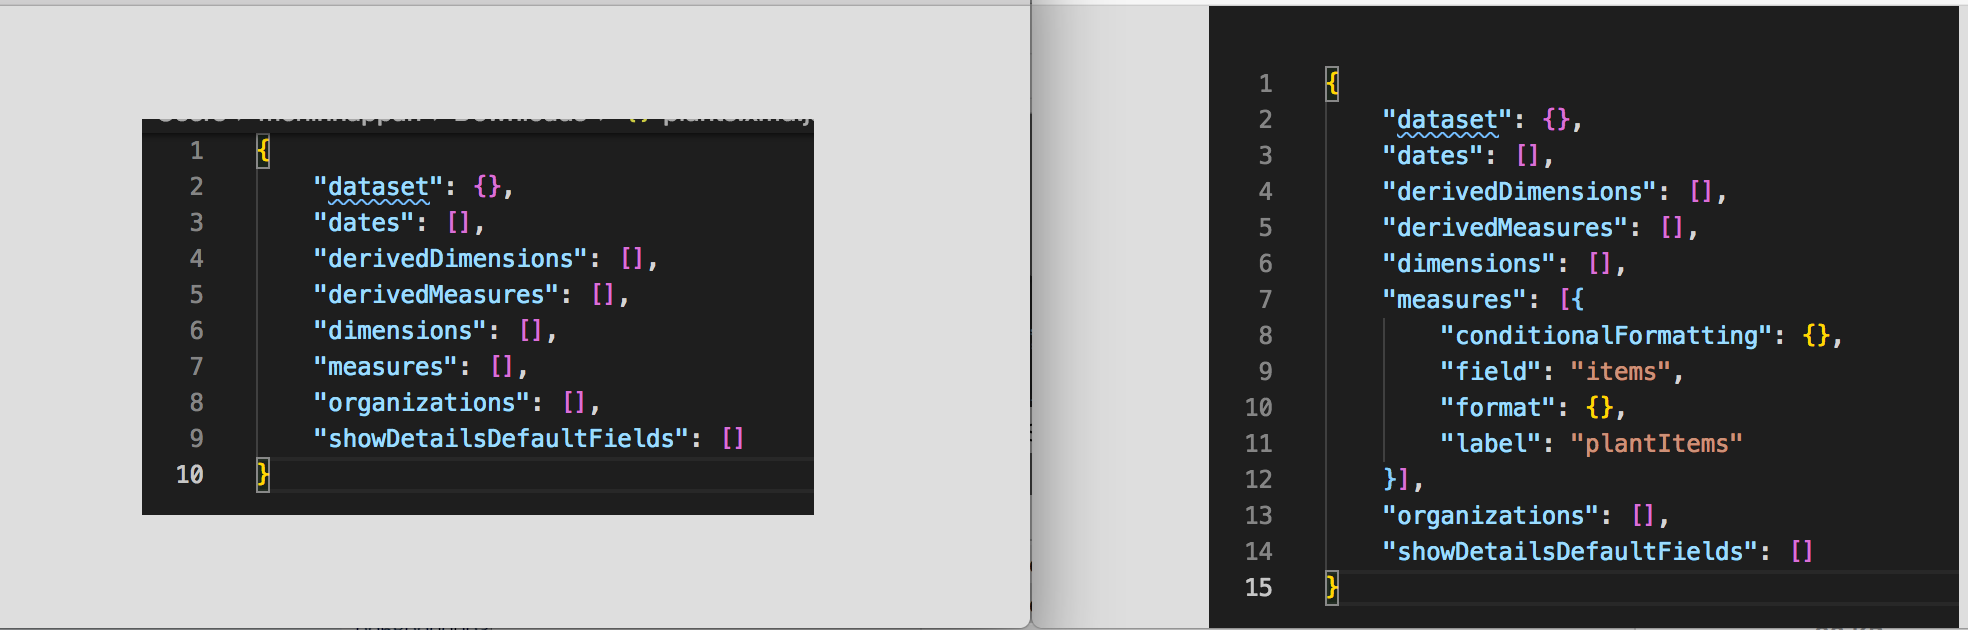
Extended Metadata (XMD)
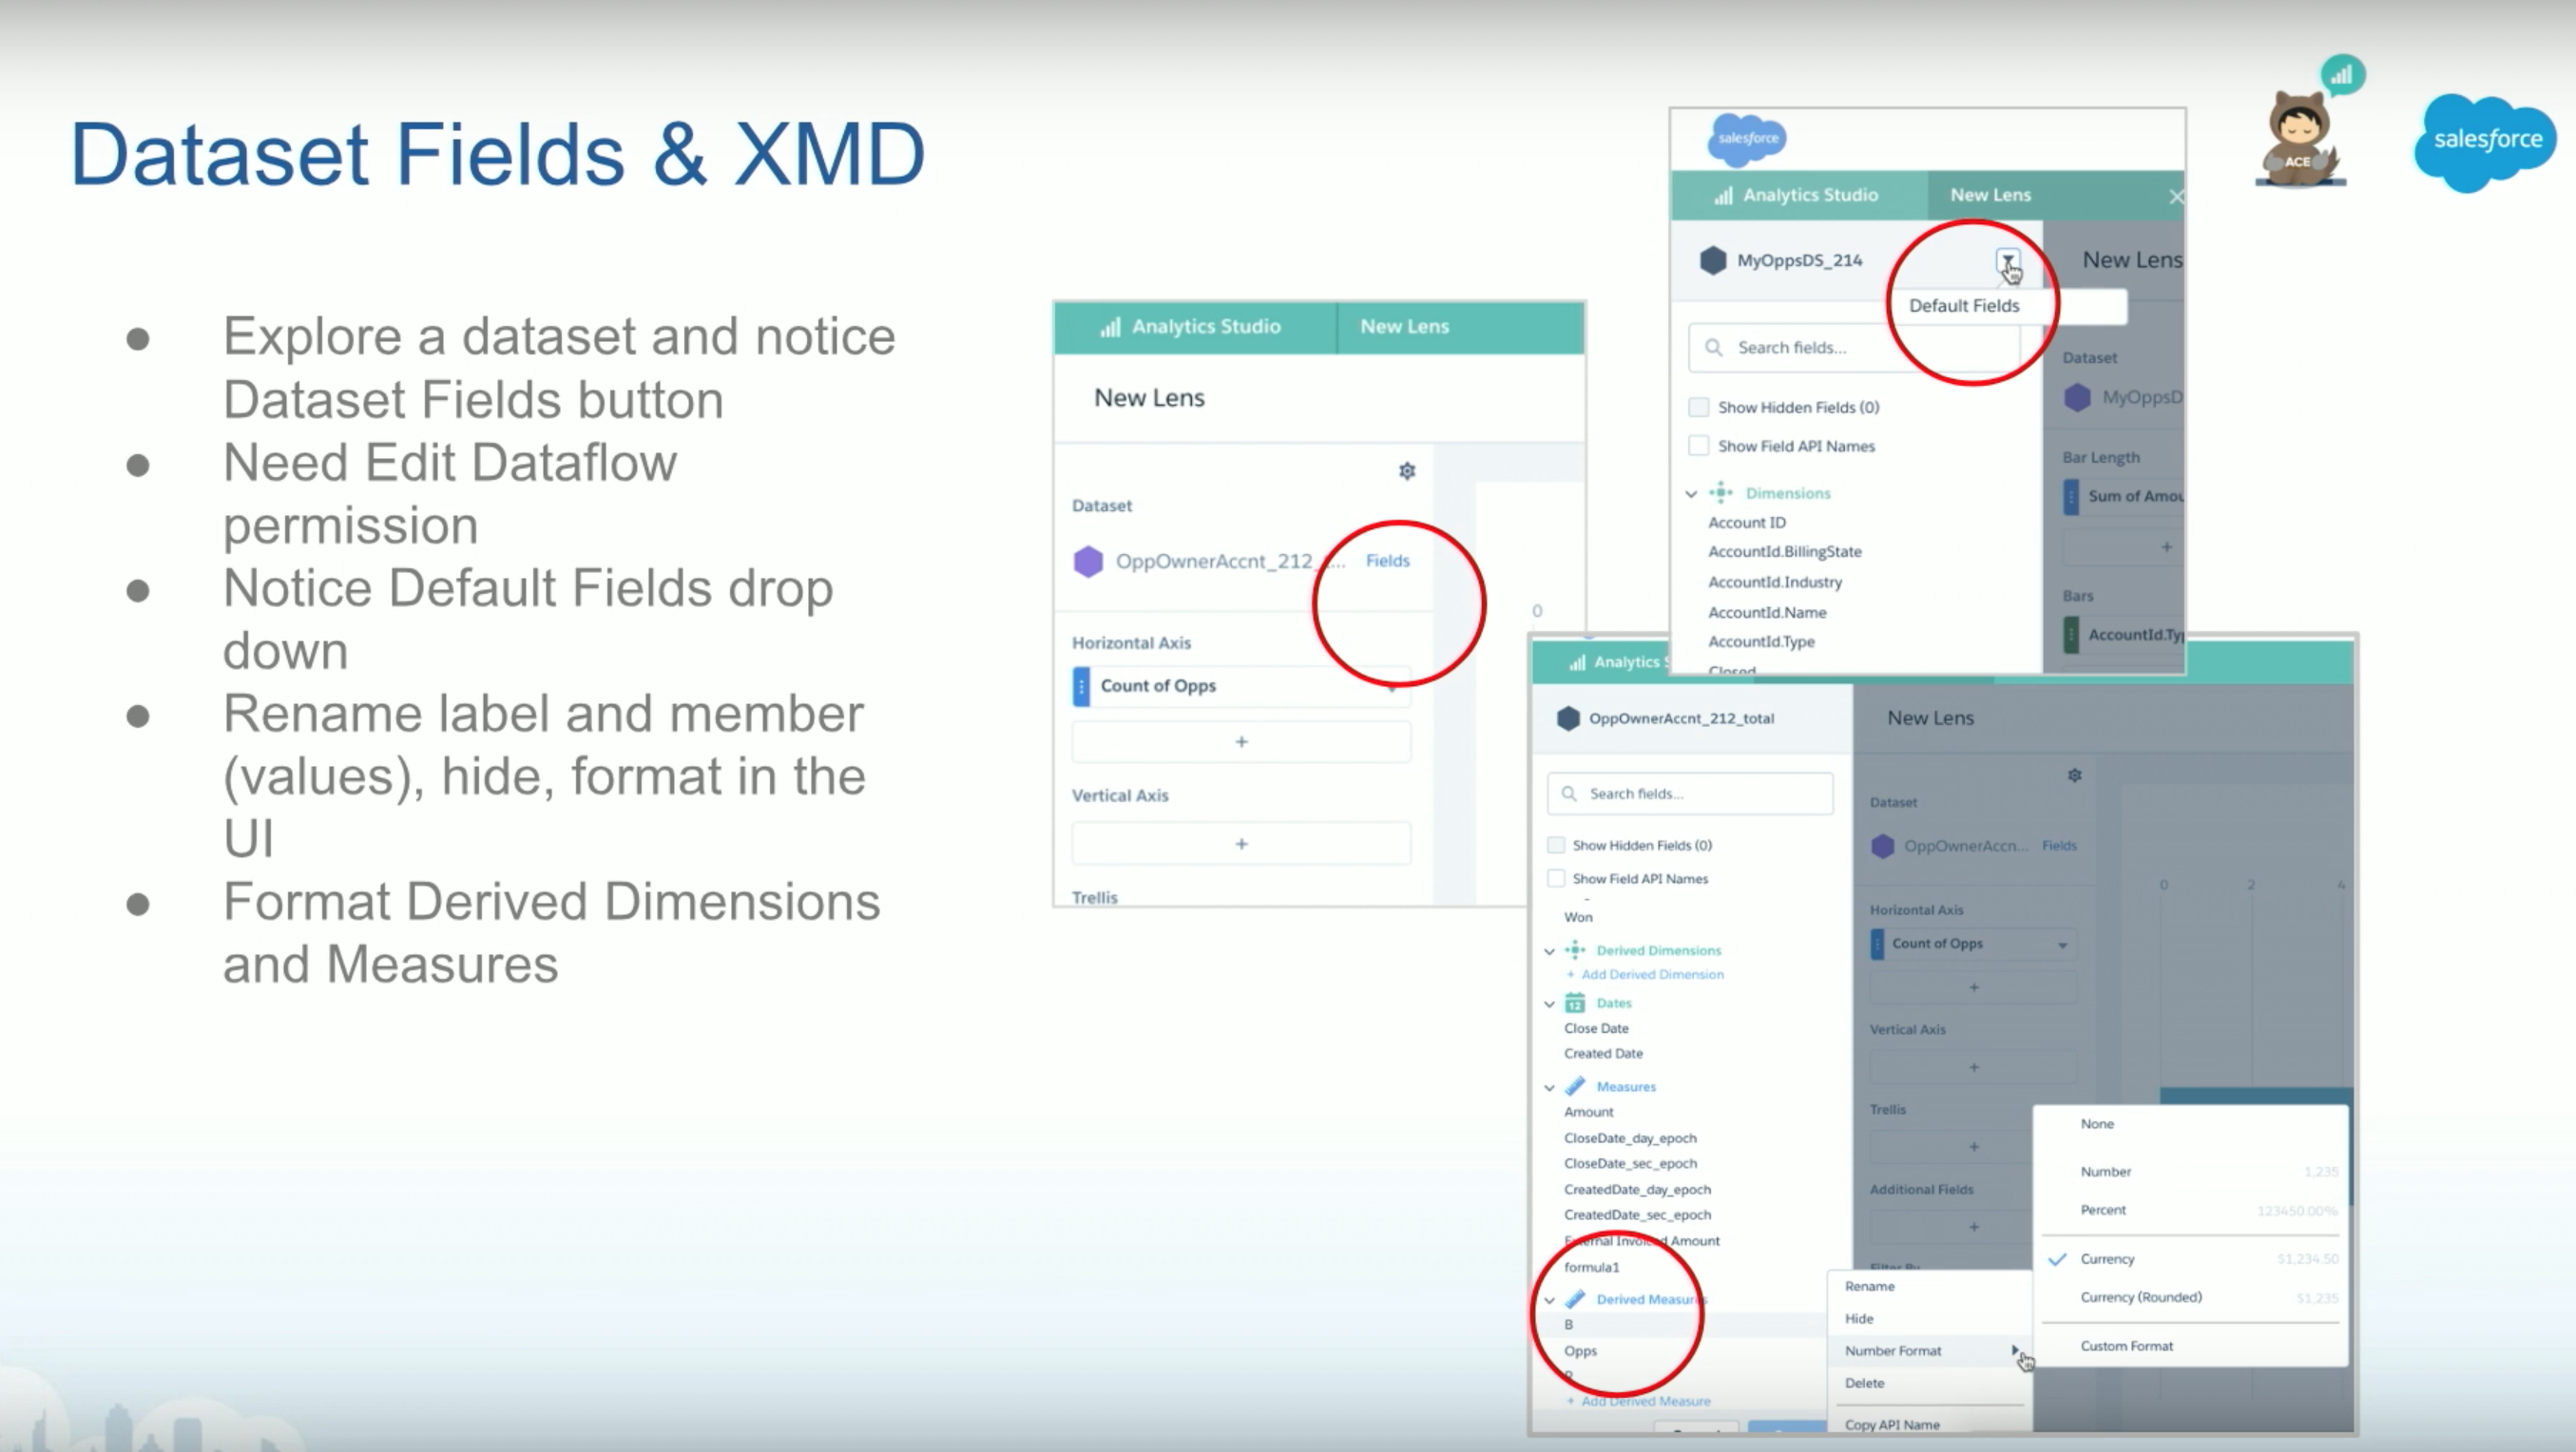
Field Rename and XMD update - changing items to plantItems
Fields Usage
Demo to view which fields are used in Dashboard from the Plants Dataset
Demo to view which fields are used in Dashboard from the Fruits Dataset
Binding in SOQL step
Demo
Binding Diagram
### Key portions of the Dashboard JSON
```
"steps": {
"opptyName_1": {
"broadcastFacet": true,
"label": "opptyName",
"selectMode": "singlerequired",
"type": "staticflex",
"values": [
{
"display": "Abbott1184",
"value": "Opportunity for Abbott1184"
},
{
"display": "Allen1162",
"value": "Opportunity for Allen1162"
}
],
"numbers": [],
"strings": [],
"groups": []
},
"soql": {
"groups": [
"Name"
],
"numbers": [
"Amount"
],
"query": "SELECT Name, Amount from Opportunity WHERE NAME IN ('{{column(opptyName_1.selection,[\"value\"]).asObject()}}')",
"selectMode": "single",
"strings": [
"Name"
],
"type": "soql"
},
"soql2": {
"groups": [],
"numbers": [
"Amount"
],
"query": "SELECT Name, CloseDate, StageName, Owner.Name, Amount, Account.Name FROM Opportunity ",
"selectMode": "single",
"strings": [
"Name",
"CloseDate",
"StageName",
"Owner.Name",
"Account.Name"
],
"type": "soql"
},
"opptyName_1": {
"broadcastFacet": true,
"label": "opptyName",
"selectMode": "singlerequired",
"type": "staticflex",
"values": [
{
"display": "Abbott1184",
"value": "Opportunity for Abbott1184"
},
{
"display": "Allen1162",
"value": "Opportunity for Allen1162"
}
],
"numbers": [],
"strings": [],
"groups": []
},
"staticIndustry_1": {
"broadcastFacet": true,
"label": "staticIndustry",
"selectMode": "singlerequired",
"type": "staticflex",
"values": [
{
"display": "Industry",
"value": "Industry"
},
{
"display": "Type",
"value": "Account_Type"
}
],
"numbers": [],
"strings": [],
"groups": []
},
"Industry_1": {
"broadcastFacet": true,
"datasets": [
{
"id": "0Fb1N000000LK1NSAW",
"label": "DTC Opportunity",
"name": "DTC_Opportunity_SAMPLE",
"url": "/services/data/v46.0/wave/datasets/0Fb1N000000LK1NSAW"
}
],
"isGlobal": false,
"query": {
"measures": [
[
"count",
"*"
]
],
"groups": [
"{{column(staticIndustry_1.selection,[\"value\"]).asObject()}}"
]
},
"receiveFacet": true,
"selectMode": "single",
"type": "aggregateflex",
"useGlobal": true,
"visualizationParameters": {
"parameters": {
"autoFitMode": "keepLabels",
"showValues": true,
"bins": {
"breakpoints": {
"high": 100,
"low": 0
},
"bands": {
"high": {
"color": "#008000",
"label": ""
},
"low": {
"color": "#B22222",
"label": ""
},
"medium": {
"color": "#ffa500",
"label": ""
}
}
},
"legend": {
"showHeader": true,
"show": true,
"customSize": "auto",
"position": "right-top",
"inside": false
},
"axisMode": "multi",
"tooltip": {
"showBinLabel": true,
"measures": "",
"showPercentage": true,
"showDimensions": true,
"showMeasures": true,
"customizeTooltip": false,
"dimensions": ""
},
"visualizationType": "hbar",
"title": {
"fontSize": 14,
"subtitleFontSize": 11,
"label": "",
"align": "center",
"subtitleLabel": ""
},
"binValues": false,
"trellis": {
"flipLabels": false,
"showGridLines": true,
"size": [
100,
100
],
"enable": false,
"type": "x",
"chartsPerLine": 4
},
"columnMap": {
"trellis": [],
"dimensionAxis": [
"Industry"
],
"plots": [
"count"
]
},
"measureAxis2": {
"sqrtScale": false,
"showTitle": true,
"showAxis": true,
"title": "",
"customDomain": {
"showDomain": false
}
},
"measureAxis1": {
"sqrtScale": false,
"showTitle": true,
"showAxis": true,
"title": "",
"customDomain": {
"showDomain": false
}
},
"theme": "wave",
"dimensionAxis": {
"showTitle": true,
"customSize": "auto",
"showAxis": true,
"title": "",
"icons": {
"useIcons": false,
"iconProps": {
"fit": "cover",
"column": "",
"type": "round"
}
}
}
},
"type": "chart",
"options": {}
}
}
}
```
### Another Example of binding in SOQL
- Here you will get IN for SOQL query clause as:
``` IN [ 'Name1', 'Name2'] ```
#### Portion of the Dashboard JSON covering this
```
"soqlStep2": {
"groups": [],
"query": "SELECT Id FROM User WHERE Name IN ('{{join(column(step_5.selection, [\"Name\"]), \"','\").asString()}}') ",
"selectMode": "single",
"strings": [
"Id"
],
"type": "soql"
}
### Multi Selection Example
#### Binding
```
"query": {
"groups": "{{column(typer_1.selection,['value']).asObject() }}"
}
```
#### Dashboard Inspector - Binding
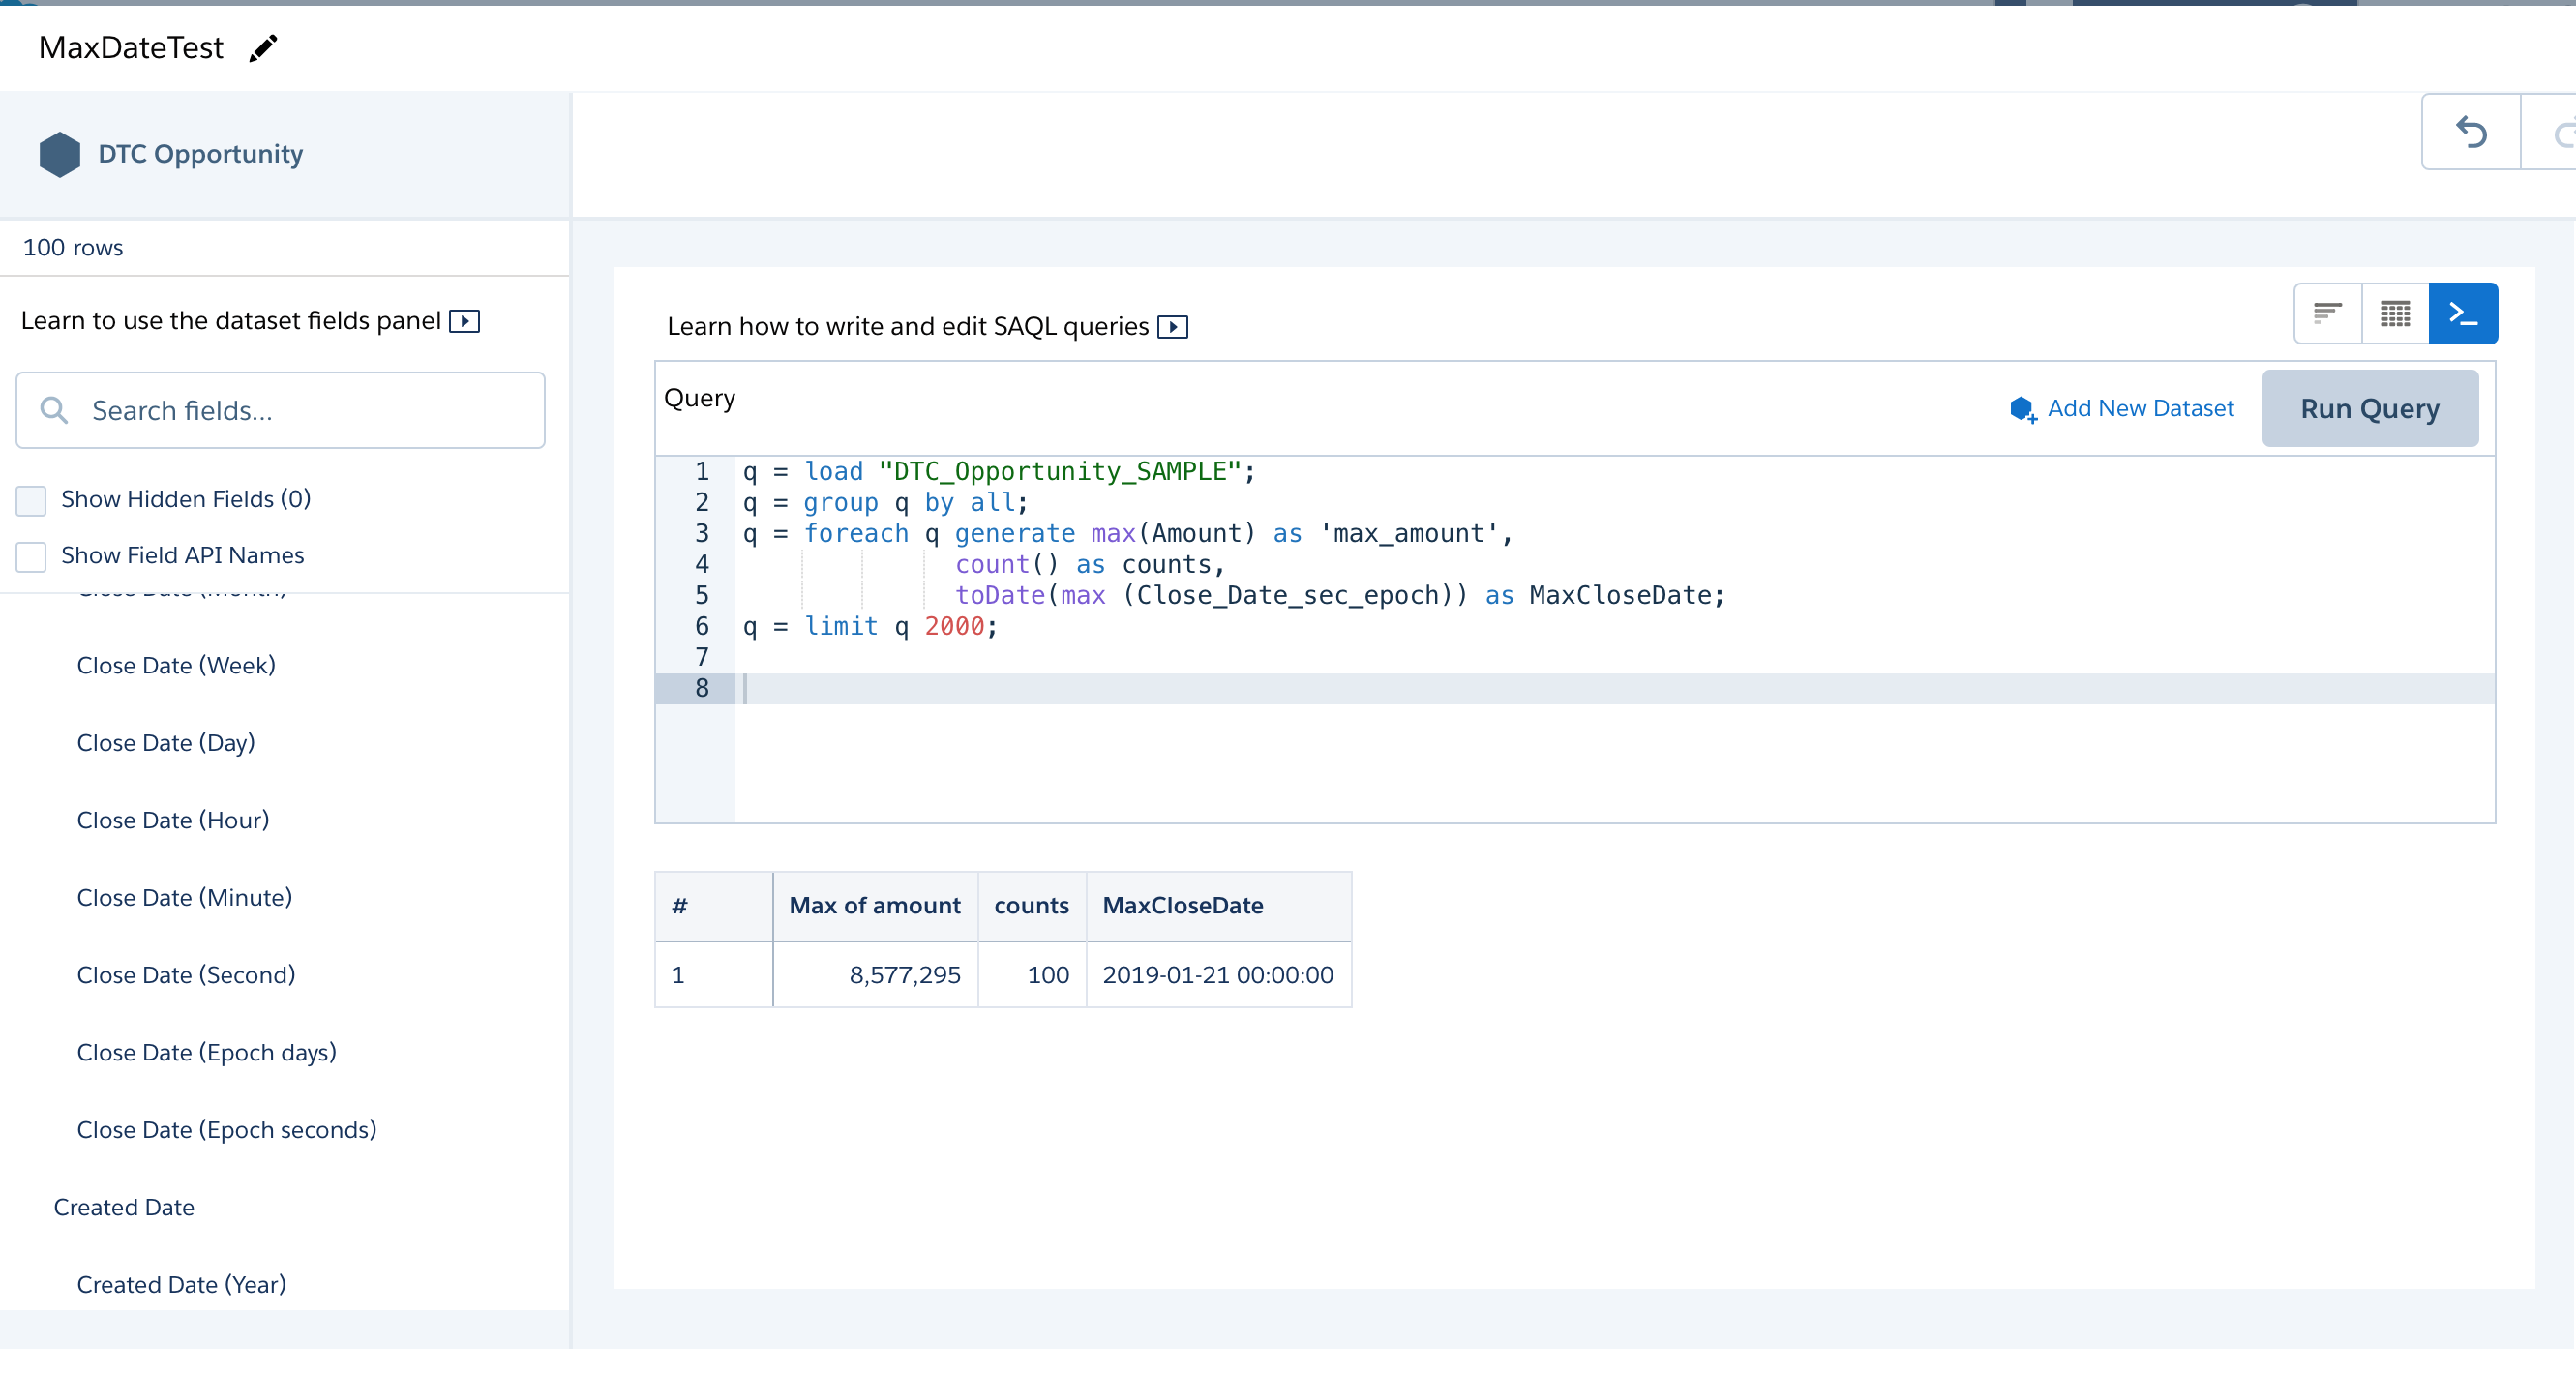
### Date Conversion Example
### How to do MAX(date) in SAQL
```
q = load "DTC_Opportunity_SAMPLE";
q = group q by all;
q = foreach q generate max(Amount) as 'max_amount',
count() as counts,
toDate(max (Close_Date_sec_epoch)) as MaxCloseDate;
q = limit q 2000;
```
### Links
- [EA binding developer guide](https://resources.docs.salesforce.com/220/latest/en-us/sfdc/pdf/bi_dev_guide_bindings.pdf)
- [Optimize Dashboard Performance](https://help.salesforce.com/articleView?id=bi_dashboards_inspector.htm&type=5)
- [Analytics Extended Metadata (XMD) Reference](https://developer.salesforce.com/docs/atlas.en-us.220.0.bi_dev_guide_xmd.meta/bi_dev_guide_xmd/bi_xmd_intro.htm)
- [Einstein Analytics: Demystifying Bindings – Part 1-9](https://www.salesforceblogger.com/2018/12/23/einstein-analytics-demystifying-bindings-part-2/)
- [SOQL Step in Salesforce Analytics Cloud Wave - Andrew Price](https://www.youtube.com/watch?v=oq1Xu94ngdY)
- [Binding Basics 4: Dynamic Limit and Results Binding](https://www.youtube.com/watch?v=c-__wUH9448)
- [Add a List Widget to Filter Dashboard Results Based on a Dimension](https://help.salesforce.com/articleView?id=bi_dashboard_widgets_filter_list_add_flex.htm&type=5)
- [Einstein Analytics Tech Lounge Mini-Series](http://salesforce.vidyard.com/watch/5UpTbk6D24GdBzyZof2dWf)